
- Title
-
A single-cell-resolution fate map of endoderm reveals demarcation of pancreatic progenitors by cell cycle
- Authors
- Yang, Y., Wang, H., He, J., Shi, W., Jiang, Z., Gao, L., Jiang, Y., Ni, R., Yang, Q., Luo, L.
- Source
- Full text @ Proc. Natl. Acad. Sci. USA

Establishment of single-cell labeling and descendant tracing techniques for endodermal progenitor cells. (A–C) Strategy of single-cell labeling and descendant tracing of early foregut endoderm. At the 4-somite stage, the 273 endodermal cells subjected to single-cell descendant tracing were aligned in a standard map. The dashed lines represent boundaries of somites (A). A single endodermal progenitor cell was labeled by green-to-red photoconversion (B). Then, localizations of its descendants at 48 hpf were detected based on the inheritance of fluorescent retention (C). (D–G) The cells at the positions R-c2s2r2 (D, n = 8), L-c5s1r3 (E, n = 8), L-c4s4r1 (F, n = 7), and R-c4s3r1 (G, n = 8), as indicated in the standard map, were individually labeled by photoconversions. Localizations of their descendant cells at 48 hpf were determined by red fluorescence according to C. Liver and pancreatic buds at 48 hpf stand to the left and right of the gut tube, respectively. (Scale bar, 50 μm.) 4-so, 4-somite stage. EXPRESSION / LABELING:
PHENOTYPE:
|
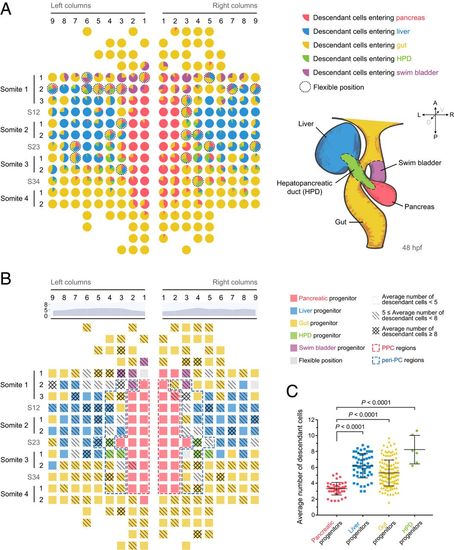
Generation of single-cell–resolution fate and proliferation maps. (A) The single-cell–resolution fate map of early foregut endoderm. This map was established based on the descendant distribution ratios of every individual foregut progenitor cell. Each pie chart represents one early endodermal progenitor cell. Different colors represent different descendant cell fates. The size of a sector represents the ratio of descendant cells entering the corresponding lineage. The dotted circles indicate flexible positions. Borderlines of different digestive organs at 48 hpf are indicated on the lower right. red, pancreas; blue, liver; green, HPD; and purple, swim bladder. (B) The single-cell resolution map was established according to the number of descendant cells produced from 4-somite to 48 hpf. Different grids indicate different ranges of descendant numbers. The area chart indicates the average number of descendant cells within each column. The value of each column represents the average number of descendant cells produced by one progenitor in this column. Red and blue dashed frames represent the PPC and peri-PC regions, respectively. (C) The statistics show the average descendant cell number produced by pancreatic progenitors (n = 43), liver progenitors (n = 55), foregut progenitors (n = 139), and HPD progenitors (n = 6). Data are expressed as mean ± SD; P value is calculated using Student’s t test. EXPRESSION / LABELING:
PHENOTYPE:
|
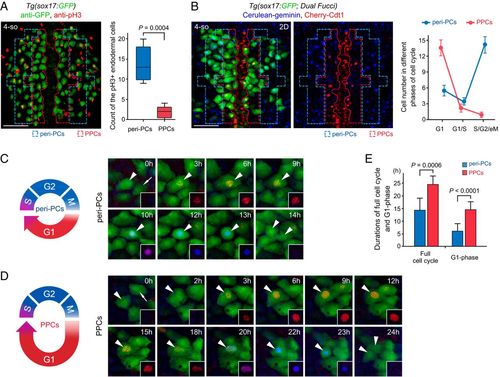
The cell cycle state of PPCs is featured by low proliferation and a long G1 phase. (A) Double immunostaining for pH3 (red) and GFP (green) in the Tg(sox17:GFP) embryos. The statistics show the number of cells double positive for pH3 and GFP in the peri-PC and PPC regions (n = 5). (B) The two-dimensional images of the Tg(sox17:GFP; Dual Fucci) transgenic line were captured covering the PPC and peri-PC regions at the 4-somite stage. The statistics show the average number of sox17+ cells in G1 phases (red), in G1/S transitions (red plus blue), and in S/G2/eM phases (blue). Note that five independent repeats represent five different embryos. (C–E) Diagrams and single-cell time-lapse live images of a full cell cycle of peri-PCs (C) and PPCs (D). The time windows between two consecutive mitotic telophases were exhibited. Arrowheads indicate the traced cells. The statistics show average durations of a full cell cycle and G1 phase of peri-PCs and PPCs (E, n = 10). (Scale bar, 50 μm.) 4-so, 4-somite stage. Data are expressed as mean ± SD; P value is calculated using Student’s t test. EXPRESSION / LABELING:
PHENOTYPE:
|
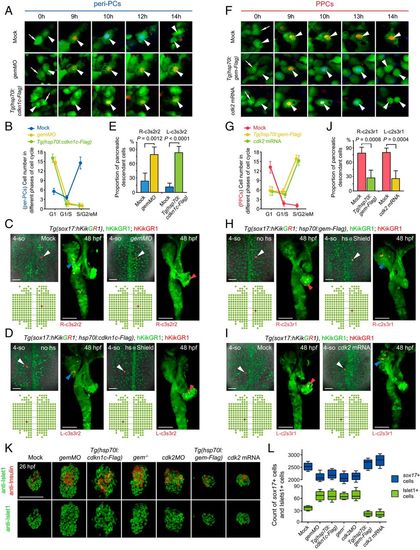
Manipulations of the cell cycle state modulate demarcation of pancreatic progenitors. (A–E) Extensive prolongation of the G1 phase of peri-PCs significantly increased their pancreatic fate propensity and enlarged pancreatic progenitor populations. Application of gemMO or heat shock–inducible overexpression of cdkn1c efficiently prolonged the G1 phase of peri-PCs as shown by single-cell live images (A, arrowheads), which was validated by the increased number of sox17+ cells in the G1 phase and reduced number of sox17+ cells in the S/G2/eM phases (B, n = 5). Consequently, examples of single-cell labeling and descendant tracing of peri-PCs showed increased descendant distributions to the pancreatic bud and gain of pancreatic progenitor identity (C and D), which were confirmed by the statistics (E, n = 5). (F–J) Shortening the G1 phase of PPCs significantly reduced their pancreatic fate propensity and pancreatic progenitor populations. Heat shock–inducible overexpression of geminin or general overexpression of cdk2 shortened the G1 phase of PPCs (F), which was validated by the reduced number of sox17+ cells in the G1 phase and increased number of sox17+ cells in the S/G2/eM phases (G, n = 5). As a result, examples of single-cell labeling and descendant tracing of PPCs showed decreased descendant distributions to the pancreatic bud and loss of pancreatic progenitor identity (H and I), which were confirmed by the statistics (J, n = 5). (K and L) After manipulations of the cell cycle state, antibody staining showed an increased and decreased number of Islet1+ and Insulin+ cells at 26 hpf (K), which were validated by statistics (L, n = 10). The corresponding alterations of the sox17+ cell number were counted by fluorescence activating cell sorter (FACS) and statistically analyzed (L, n = 5). (Scale bar, 50 μm.) 4-so, 4-somite stage; gem, geminin; hs, heat shock. Data are expressed as mean ± SD; P value is calculated using Student’s t test. EXPRESSION / LABELING:
PHENOTYPE:
|
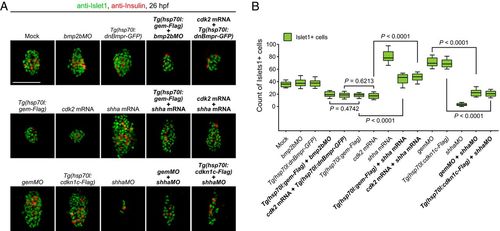
The coordination of the cell cycle state and pancreatic fate propensity involves Shh signaling. (A) The shha mRNA but not bmpMO or the dominant-negative Bmpr rescued the reduction of pancreatic endocrine cells caused by overexpression of geminin or Cdk2. The shhaMO rescued the expansion of pancreatic endocrine cells caused by gemMO or Cdkn1c overexpression. (B) The results were confirmed by the statistics (n = 5). (Scale bar, 50 μm.) Data are expressed as mean ± SD; P value is calculated using Student’s t test. |

Manipulations of the cell cycle state specifically in PPCs or peri-PCs cell-autonomously modulate their pancreatic fate propensity. (A) Schematic diagram of transplantation strategy. Donor embryos were injected with mock or gemMO or gem mRNA together with cas mRNA and rhodamine dextran (red). Transplantations into the Tg(sox17:GFP) host embryos were performed at the 1,000-cell stage. The host embryos with donor cells incorporated into peri-PCs or PPCs were identified and collected at the 4-somite stage and analyzed for descendant distributions at 48 hpf. (B and C) When donor cells were incorporated into peri-PCs, the gemMO donor cells produced more pancreatic descendant cells than mock donor cells (B), which were confirmed by the statistics (C, n = 5). (D and E) When donor cells were incorporated into PPCs, the gem mRNA donor cells produced fewer pancreatic descendant cells than mock donor cells (D), which were confirmed by the statistics (E, n = 5). (Scale bar, 50 μm.) 4-so, 4-somite stage; gem, geminin; cas, casanova. Data are expressed as mean ± SD; P value is calculated using Student’s t test. |