
- Title
-
Flavin Adenine Dinucleotide Depletion Caused by electron transfer flavoprotein subunit alpha Haploinsufficiency Leads to Hepatic Steatosis and Injury in Zebrafish
- Authors
- Park, K.H., Gooz, M., Ye, Z.W., Zhang, J., Beeson, G.C., Rockey, D.C., Kim, S.H.
- Source
- Full text @ Hepatol Commun
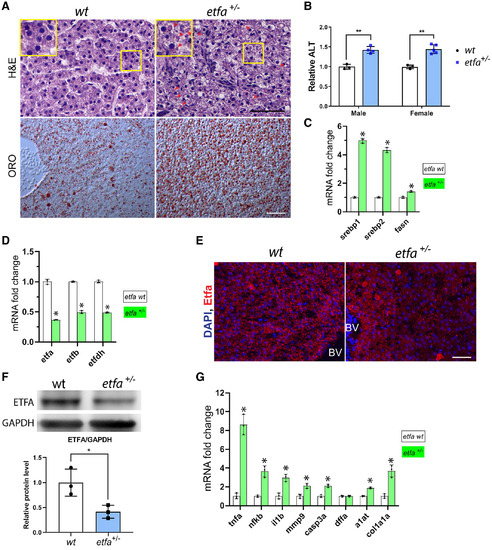
Etfa haploinsufficiency induces hepatic injury and steatosis in adult zebrafish. (A) Representative images show hepatocyte ballooning and accumulation of cytosolic components (note eosinophilic cytoplasmic droplets marked with arrow heads) in hepatocytes in etfa+/− livers (H&E staining). Magnified views (yellow rectangles) are shown. In the bottom panels, sections were stained with ORO (representative images are shown, n = 5/5); scale bar, 50 µm. (B) Relative serum ALT levels in etfa+/− siblings compared to the wild type (n = 3 to 5). (C) Livers were harvested, and pooled total RNA was subjected to qRT-PCR (see Materials and Methods) to determine relative mRNA expression genes associated with de novo lipogenesis (srebp1, srebp2, and fasn). (D) Relative mRNA expression of genes of etfa, etfb, and etfdh (*P < 0.05 vs. the wild type). (E) Immunofluorescence staining with anti-Etfa antibody (red) on wild-type and etfa+/− liver sections; scale bar, 50 µm. Nuclei were stained with DAPI. (F) Relative amount of Etfa protein in wild-type and etfa+/– liver lysates (n = 3). (G) Relative mRNA expression of genes associated with inflammation (tnfa, nfkb, il1b, and mmp9), cell death (casp3a and dffa), injury (a1at), and fibrosis (col1a1a). Pooled RNAs (from three livers per group) were used for qRT-PCR analysis. *P < 0.05, **P < 0.005 vs. the wild type. Data in bar graphs represent mean ± SD. Abbreviations: BV, blood vessel; DAPI, 4′,6-diamidino-2-phenylindole; GAPDH, glyceraldehyde 3-phosphate dehydrogenase. |
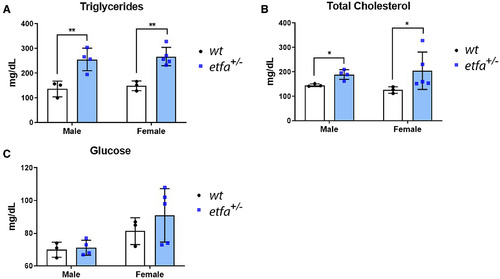
Etfa+/− zebrafish exhibit hyperlipidemia and hypercholesterolemia. (A) Blood was drawn (see Materials and Methods), and serum TGs, (B) TC, and (C) glucose were measured in male and female wild-type (n = 3, white bars) and etfa+/− siblings (n = 4, blue bars). *P < 0.05, **P < 0.005 versus the wild type. Data represent mean ± SD. |
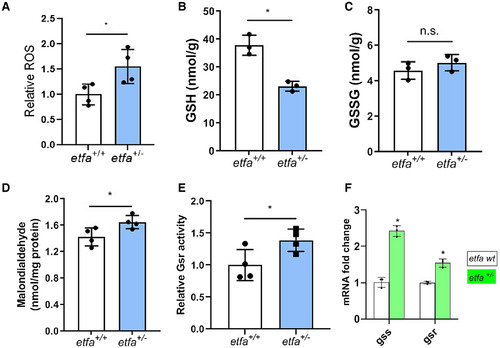
Etfa haploinsufficiency increases oxidative stress in the liver. (A) ROS (H2O2), (B) GSH, (C) GSSG, and (D) MDA were measured in wild-type and etfa+/− male siblings (see Materials and Methods). (E) Relative activity of Gsr in etfa+/− siblings versus the wild type (n = 4), and (F) mRNA expression of gss and gsr. Error bars show the mean ± SD; *P < 0.05. Abbreviation: n.s., not significant. |

Riboflavin supplementation suppresses hepatic injury and genes associated with inflammation in etfa+/− livers. Adult zebrafish were exposed to riboflavin containing water (0.6 mg/L) for 1 week, with water replacement (with riboflavin) once per day. Whole livers were harvested, and relative amounts of (A) FAD levels and (B) serum ALT levels were measured in etfa+/− with (white bars) or without (blue bars) riboflavin treatment compared to the wild type (etfa+/+) (see Materials and Methods) (n = 4 to 6). (C) Representative images of H&E-stained liver sections in the wild type and etfa+/− mutants with or without riboflavin treatment (n > 6 per each); scale bar, 25 µm. (D) Total RNA was isolated from whole livers as above, and mRNA expression of genes associated with inflammation (tnfa, nfkb, il1b, and mmp9), cell death (casp3a and dffa), injury (a1at), and fibrosis (col1a1a) from pooled RNA were measured by qRT-PCR (see Materials and Methods). (E) Changes in relative mRNA expression levels of flad1 were also measured. An equal amount of total RNA from three livers were pooled and used for cDNA synthesis; the same amount of cDNA was used for qPCR analyses. Error bars show mean ± SD; *P < 0.05, **P < 0.005. Abbreviation: n.s., not significant. |
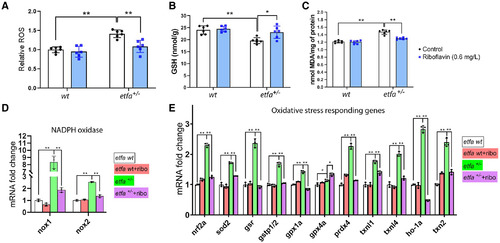
Riboflavin supplementation suppresses oxidative stress in etfa+/− mutant livers. Adult zebrafish were exposed to riboflavin, as in Fig. 4. (A) Relative ROS, (B) GSH levels, and (C) MDA levels in wild-type and etfa+/− livers from untreated or riboflavin-treated adult zebrafish were measured (see Materials and Methods) (n = 6 per group). Relative mRNA expression of (D) NADPH oxidases and (E) oxidative stress-responding genes was measured (see Materials and Methods; three livers were used to make normalized RNA; *P < 0.05, **P < 0.005). Abbreviations: gstp1/2, glutathione S transferase pi 1 and 2; ho-1a, heme oxygenase 1a; nrf2, nuclear factor erythroid 2-related factor 2; prdx4, peroxiredoxin 4. |
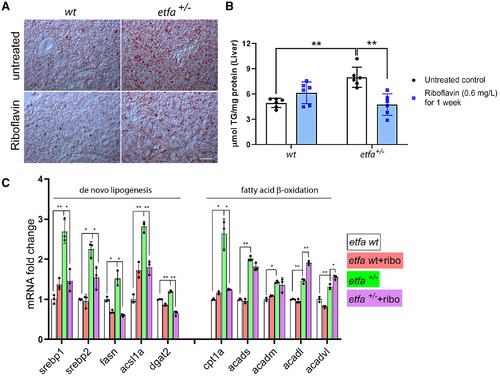
Riboflavin supplementation attenuates hepatic steatosis in etfa+/− livers by suppressing mRNA expression of genes in de novo lipogenesis and lipid uptake. Adult zebrafish were exposed to riboflavin, as in Fig. 4. (A) Representative images of ORO staining (n = 5 per group) in the wild type and etfa+/− mutants with or without riboflavin treatment for 1 week; Scale bar, 50 µm. (B) TG analysis in liver lysates from wild-type and etfa+/− livers with or without riboflavin treatment (n = 6 per group). (C) Relative mRNA expression of genes associated with de novo lipogenesis (srebp1, srebp2, fasn, acsl1a, and dgat2) and fatty acid β-oxidation (cpt1a, acads, acadm, acadl, and acadvl) was measured by qRT-PCR (see Materials and Methods; n = 3 per group, *P < 0.05, **P < 0.005). |
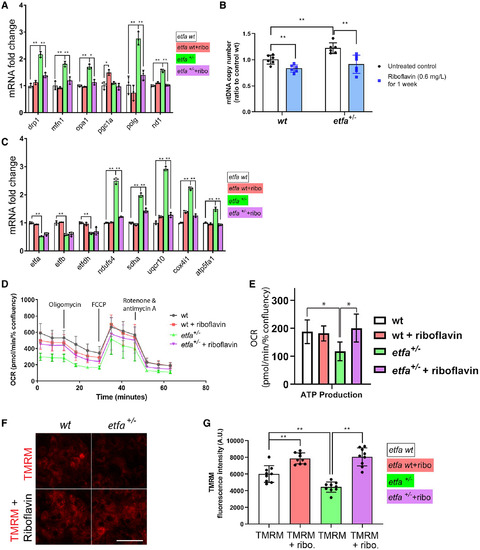
Effects of riboflavin on mitochondria in etfa+/− livers. Adult zebrafish were exposed to riboflavin, as in Fig. 4. Livers were harvested and (A) relative mRNA expression of genes associated with mitochondrial homeostasis and biogenesis, (B) relative copy number of mtDNA, and (C) relative mRNA expressions of genes in the ETF complex and mitochondrial complexes (I to V) in wild-type or etfa+/− livers with or without riboflavin treatment were measured by qRT-PCR (see Materials and Methods). (D) Hepatocytes were isolated, incubated for 3 days with or without riboflavin (0.6 mg/L), and OCR analysis was performed using Seahorse XF96 (see Materials and Methods). (E) ATP production-associated OCR in each group (n = 4; *P < 0.05, **P < 0.005). (F) Representative fluorescence images of TMRM-loaded wild-type and etfa+/− hepatocytes with or without riboflavin treatment; scale bar, 50 µm. (G) Mitochondrial membrane potential was compared by TMRM fluorescence intensity of hepatocytes in (F). Abbreviations: ATP, adenosine triphosphate; atp5fa1, adenosine triphosphate synthase F1 subunit alpha; A.U., arbitrary units; cox4i1, cytochrome c oxidase subunit 4 isoform 1; min, minutes; ndufs4, nicotinamide adenine dinucleotide:ubiquinone oxidoreductase subunit S4; pgc1a, peroxisome proliferator-activated receptor gamma coactivator 1-alpha; sdha, succinate dehydrogenase complex flavoprotein subunit A; uqcr10, ubiquinol-cytochrome c reductase 10. |
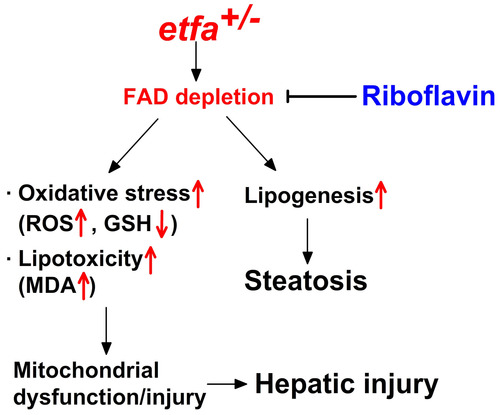
Diagram demonstrating etfa haploinsufficiency-induced hepatic steatosis and injury. Etfa haploinsufficiency causes FAD reduction in the liver, which in turn increases lipogenesis/steatosis in the liver. Additionally, increased oxidative stress and lipotoxicity by FAD depletion lead to mitochondrial dysfunction/injury that causes hepatocellular injury. |