
- Title
-
The probiotic Lactobacillus rhamnosus mimics the dark-driven regulation of appetite markers and melatonin receptors' expression in zebrafish (Danio rerio) larvae: Understanding the role of the gut microbiome
- Authors
- Lutfi, E., Basili, D., Falcinelli, S., Morillas, L., Carnevali, O., Capilla, E., Navarro, I.
- Source
- Full text @ Comp. Biochem. Physiol. B Biochem. Mol. Biol.
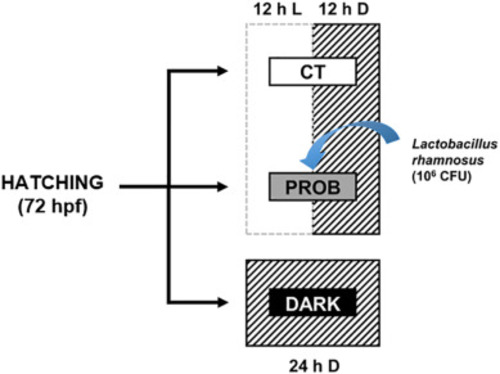
Fig. 1. Schematic representation of the experimental design. Zebrafish larvae were divided into 3 groups at hatching (72 hpf): one group was exposed to a 12:12 h light/darkness (CT, control), the second was exposed to the same photoperiod and treated with the probiotic L. rhamnosus (PROB), and the third one was exposed to 24 h of darkness (DARK). |
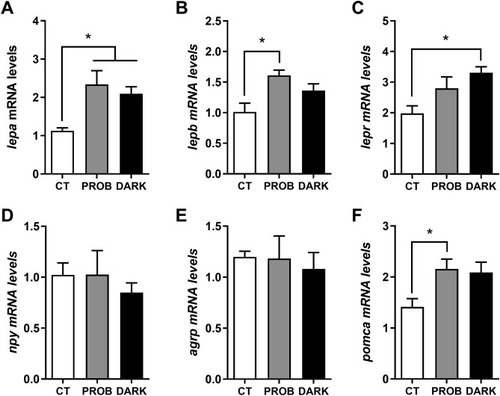
Fig. 2. Gene expression levels of appetite-related markers. Leptin a (lepa, A), leptin b (lepb, B), leptin receptor (lepr, C), neuropeptide Y (npy, D), agouti-related protein (agrp, E) and proopiomelanocortin (pomca, F) mRNA levels of zebrafish larvae exposed to the following conditions: 12:12 h light/darkness (CT, control), the same photoperiod while treated with the probiotic Lactobacillus rhamnosus (PROB), or 24 h of darkness (DARK). Relative expression levels were normalized to the geometric mean of two reference genes, beta actin (bactin) and acidic ribosomal protein (arp). Data are shown as mean+SEM (n = 4-5). Significant differences (p < 0.05) are indicated by asterisks and, were determined using a one-way ANOVA followed by Tukey's post hoc test. |
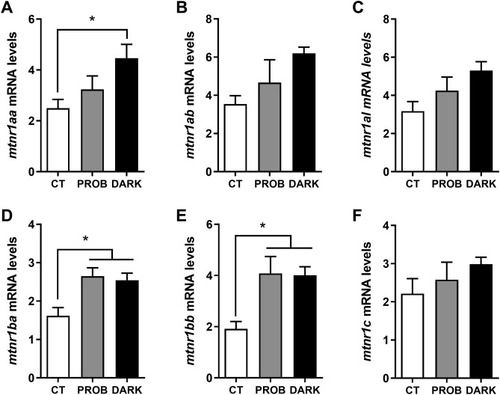
Fig. 3. Gene expression levels of melatonin receptors. Melatonin receptor (mtnr) 1Aa (mtnr1aa, A), mtnr 1Ab (mtnr1ab, B), mtnr type 1A like (mtnr1al, C), mtnr 1Ba (mtnr1ba, D), mtnr 1Bb (mtnr1bb, E) and mtnr 1C (mtnr1c, F) mRNA levels of zebrafish larvae exposed to the following conditions: 12:12 h light/darkness (CT, control), the same photoperiod while treated with the probiotic Lactobacillus rhamnosus (PROB), or 24 h of darkness (DARK). Relative expression levels were normalized to the geometric mean of two reference genes, beta actin (bactin) and acidic ribosomal protein (arp). Data are shown as mean+SEM (n = 4-5). Significant differences (p < 0.05) are indicated by asterisks and, were determined using a one-way ANOVA followed by Tukey's post hoc test. |

Fig. 4. Protein expression levels of melatonin receptor 1. Representative immunoreactive bands and quantification of melatonin receptor 1 (MTNR1) protein expression of zebrafish larvae exposed to the following conditions: 12:12 h light/darkness (CT, control), the same photoperiod while treated with the probiotic Lactobacillus rhamnosus (PROB), or 24 h of darkness (DARK). Densitometry levels of each specific MTNR1 band (~50 KDa) were normalized by the densitometry values of the 2 most abundant bands of Revert Total Protein staining (~ 37 KDa). Data are shown as mean+SEM (n = 3-4). Significant differences (p < 0.05) are indicated by asterisks and, were determined using a one-way ANOVA followed by Tukey's post-hoc test. |
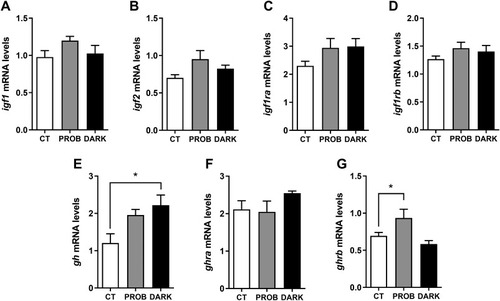
Fig. 5. Gene expression levels of insulin-like growth factors and growth hormone-related markers. Insulin-like growth factor (igf) 1 (igf1, A), igf 2 (igf2, B), igf receptor a (igf1ra, C), igf receptor b (igf1rb, D), growth hormone (gh, E), growth hormone receptor a (ghra, F) and growth hormone receptor b (ghrb, G) mRNA levels of zebrafish larvae exposed to the following conditions: 12:12 h light/darkness (CT, control), the same photoperiod while treated with the probiotic Lactobacillus rhamnosus (PROB), or 24 h of darkness (DARK). Relative expression levels were normalized to the geometric mean of two reference genes, beta actin (bactin) and acidic ribosomal protein (arp). Data are shown as mean+SEM (n = 4-5). Significant differences (p < 0.05) are indicated by asterisks and, were determined using a one-way ANOVA followed by Tukey's post hoc test. |

Fig. 6. Gastrointestinal bacterial community analysis. Zebrafish larvae were exposed to the following conditions: 12:12 h light/darkness (CT, control), the same photoperiod while treated with the probiotic Lactobacillus rhamnosus (PROB), or 24 h of darkness (DARK). Stacked bar chart representing the relative abundance of bacterial phylum (A) and class (B) (only taxa contributing to at least 1% of the total composition are displayed). Venn diagram showing the distribution of OTUs at genera level (C). Bubble chart showing genera differentially abundant upon the different conditions (abundance greater than 1%), determined by a pairwise test adjusted for multiple comparisons (Benjamini-Hochberg) (n = 2-3). Bubble size indicates higher (big) or lower (small) relative abundance of bacterial genera (D). |
Reprinted from Comparative biochemistry and physiology. Part B, Biochemistry & molecular biology, 256, Lutfi, E., Basili, D., Falcinelli, S., Morillas, L., Carnevali, O., Capilla, E., Navarro, I., The probiotic Lactobacillus rhamnosus mimics the dark-driven regulation of appetite markers and melatonin receptors' expression in zebrafish (Danio rerio) larvae: Understanding the role of the gut microbiome, 110634, Copyright (2021) with permission from Elsevier. Full text @ Comp. Biochem. Physiol. B Biochem. Mol. Biol.