
|
Fig. 6
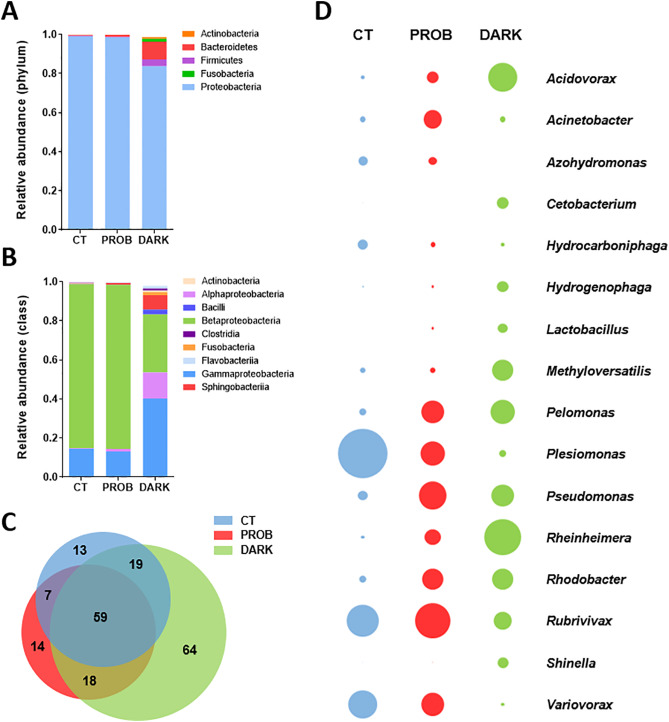
Fig. 6. Gastrointestinal bacterial community analysis. Zebrafish larvae were exposed to the following conditions: 12:12 h light/darkness (CT, control), the same photoperiod while treated with the probiotic Lactobacillus rhamnosus (PROB), or 24 h of darkness (DARK). Stacked bar chart representing the relative abundance of bacterial phylum (A) and class (B) (only taxa contributing to at least 1% of the total composition are displayed). Venn diagram showing the distribution of OTUs at genera level (C). Bubble chart showing genera differentially abundant upon the different conditions (abundance greater than 1%), determined by a pairwise test adjusted for multiple comparisons (Benjamini-Hochberg) (n = 2-3). Bubble size indicates higher (big) or lower (small) relative abundance of bacterial genera (D).
Reprinted from Comparative biochemistry and physiology. Part B, Biochemistry & molecular biology, 256, Lutfi, E., Basili, D., Falcinelli, S., Morillas, L., Carnevali, O., Capilla, E., Navarro, I., The probiotic Lactobacillus rhamnosus mimics the dark-driven regulation of appetite markers and melatonin receptors' expression in zebrafish (Danio rerio) larvae: Understanding the role of the gut microbiome, 110634, Copyright (2021) with permission from Elsevier. Full text @ Comp. Biochem. Physiol. B Biochem. Mol. Biol.