
|
Fig. 2
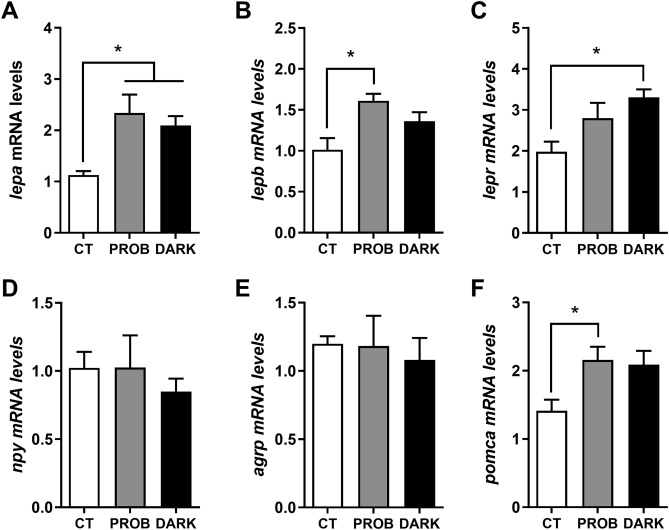
Fig. 2. Gene expression levels of appetite-related markers. Leptin a (lepa, A), leptin b (lepb, B), leptin receptor (lepr, C), neuropeptide Y (npy, D), agouti-related protein (agrp, E) and proopiomelanocortin (pomca, F) mRNA levels of zebrafish larvae exposed to the following conditions: 12:12 h light/darkness (CT, control), the same photoperiod while treated with the probiotic Lactobacillus rhamnosus (PROB), or 24 h of darkness (DARK). Relative expression levels were normalized to the geometric mean of two reference genes, beta actin (bactin) and acidic ribosomal protein (arp). Data are shown as mean+SEM (n = 4-5). Significant differences (p < 0.05) are indicated by asterisks and, were determined using a one-way ANOVA followed by Tukey's post hoc test.
Reprinted from Comparative biochemistry and physiology. Part B, Biochemistry & molecular biology, 256, Lutfi, E., Basili, D., Falcinelli, S., Morillas, L., Carnevali, O., Capilla, E., Navarro, I., The probiotic Lactobacillus rhamnosus mimics the dark-driven regulation of appetite markers and melatonin receptors' expression in zebrafish (Danio rerio) larvae: Understanding the role of the gut microbiome, 110634, Copyright (2021) with permission from Elsevier. Full text @ Comp. Biochem. Physiol. B Biochem. Mol. Biol.