
|
Fig. 4
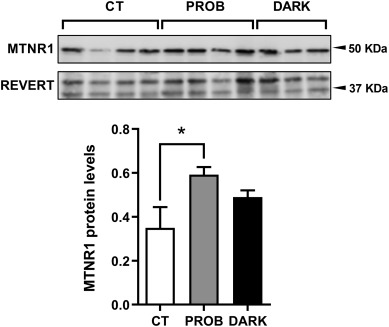
Fig. 4. Protein expression levels of melatonin receptor 1. Representative immunoreactive bands and quantification of melatonin receptor 1 (MTNR1) protein expression of zebrafish larvae exposed to the following conditions: 12:12 h light/darkness (CT, control), the same photoperiod while treated with the probiotic Lactobacillus rhamnosus (PROB), or 24 h of darkness (DARK). Densitometry levels of each specific MTNR1 band (~50 KDa) were normalized by the densitometry values of the 2 most abundant bands of Revert Total Protein staining (~ 37 KDa). Data are shown as mean+SEM (n = 3-4). Significant differences (p < 0.05) are indicated by asterisks and, were determined using a one-way ANOVA followed by Tukey's post-hoc test.
Reprinted from Comparative biochemistry and physiology. Part B, Biochemistry & molecular biology, 256, Lutfi, E., Basili, D., Falcinelli, S., Morillas, L., Carnevali, O., Capilla, E., Navarro, I., The probiotic Lactobacillus rhamnosus mimics the dark-driven regulation of appetite markers and melatonin receptors' expression in zebrafish (Danio rerio) larvae: Understanding the role of the gut microbiome, 110634, Copyright (2021) with permission from Elsevier. Full text @ Comp. Biochem. Physiol. B Biochem. Mol. Biol.