
|
Fig. 3
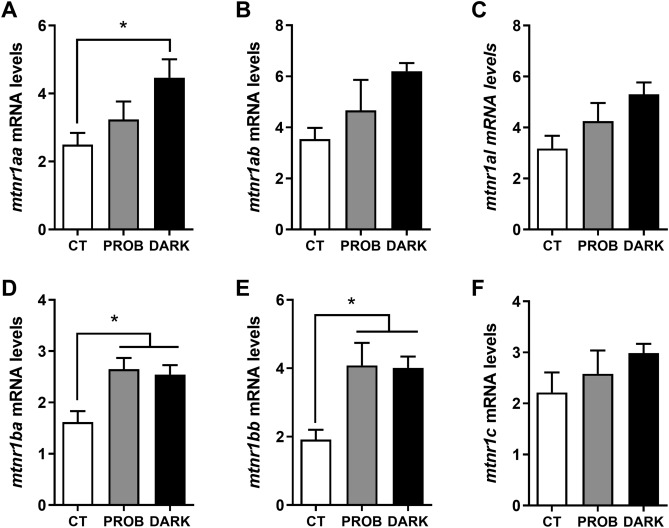
Fig. 3. Gene expression levels of melatonin receptors. Melatonin receptor (mtnr) 1Aa (mtnr1aa, A), mtnr 1Ab (mtnr1ab, B), mtnr type 1A like (mtnr1al, C), mtnr 1Ba (mtnr1ba, D), mtnr 1Bb (mtnr1bb, E) and mtnr 1C (mtnr1c, F) mRNA levels of zebrafish larvae exposed to the following conditions: 12:12 h light/darkness (CT, control), the same photoperiod while treated with the probiotic Lactobacillus rhamnosus (PROB), or 24 h of darkness (DARK). Relative expression levels were normalized to the geometric mean of two reference genes, beta actin (bactin) and acidic ribosomal protein (arp). Data are shown as mean+SEM (n = 4-5). Significant differences (p < 0.05) are indicated by asterisks and, were determined using a one-way ANOVA followed by Tukey's post hoc test.
Reprinted from Comparative biochemistry and physiology. Part B, Biochemistry & molecular biology, 256, Lutfi, E., Basili, D., Falcinelli, S., Morillas, L., Carnevali, O., Capilla, E., Navarro, I., The probiotic Lactobacillus rhamnosus mimics the dark-driven regulation of appetite markers and melatonin receptors' expression in zebrafish (Danio rerio) larvae: Understanding the role of the gut microbiome, 110634, Copyright (2021) with permission from Elsevier. Full text @ Comp. Biochem. Physiol. B Biochem. Mol. Biol.