
- Title
-
Chestnut Shell Tannins: Effects on Intestinal Inflammation and Dysbiosis in Zebrafish
- Authors
- Orso, G., Solovyev, M.M., Facchiano, S., Tyrikova, E., Sateriale, D., Kashinskaya, E., Pagliarulo, C., Hoseinifar, H.S., Simonov, E., Varricchio, E., Paolucci, M., Imperatore, R.
- Source
- Full text @ Animals (Basel)
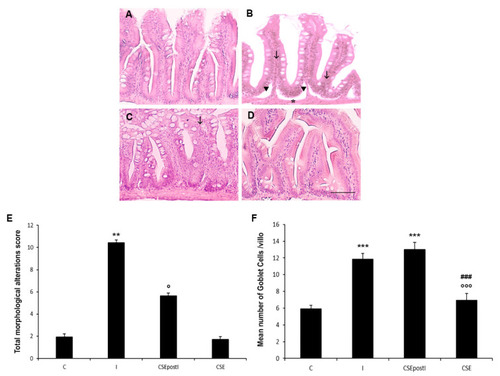
Haematoxylin-eosin (H&E) staining of MI of (A) control zebrafish (C), (B) inflamed zebrafish (I), (C) inflamed zebrafish post-treated with chestnut shell extract (CSEpostI) and (D) zebrafish fed chestnut shell extract (CSE). Scale bar: 100 µm. Arrows indicate leucocytes infiltrates, arrowheads indicate ragged villi, asterisks indicate mucosal thinning. (E) Bar graph showing the total intestinal alteration score defined for each zebrafish group. Data are expressed as mean ±SE. ** p < 0.001 compared to the control group; ° p < 0.05 compared to the inflamed group. (F) Bar graph showing the number of goblet cells in the MI of C, I, CSEpostI and CSE. Goblet cells were counted based on Alcian Blue staining. Data are expressed as mean ±SE. *** p < 0.0001 compared to the control group; °°° p < 0.0001 compared to the inflamed group; ### p < 0.0001 compared to the CSEpostI group. |

TNFα immunostaining in the MI of (A) control zebrafish (C), (B) inflamed zebrafish (I), (C) inflamed zebrafish post-treated with chestnut shell extract (CSEpostI) and (D) zebrafish fed chestnut shell extract (CSE). Scale bar: 50 µm. Asterisks indicate infiltrated eosinophils and fibroblasts expressing TNFα. (E) Bar graph showing TNFα optical density (O.D.) in the MI of C, I, CSEpostI and CSE. Data are expressed as mean ±SE. *** p < 0.0001 compared to C group; °°° p < 0.0001, °° p < 0.001 compared to the I group; ### p < 0.0001 compared to the CSEpostI group. |

COX2 immunostaining in the MI of (A) control zebrafish (C), (B) inflamed zebrafish (I), (C) inflamed zebrafish post-treated with chestnut shell extract (CSEpostI) and (D) zebrafish fed chestnut shell extract (CSE). Scale bar: 50 µm. (E) Bar graph showing COX2 optical density (O.D.) in the MI of control, inflamed, CSEpostI and CSE zebrafish. Data are expressed as mean ±SE. *** p < 0.0001 compared to control group; °°° p < 0.0001 compared to the inflamed group; ### p < 0.0001 compared to the CSEpostI group. |
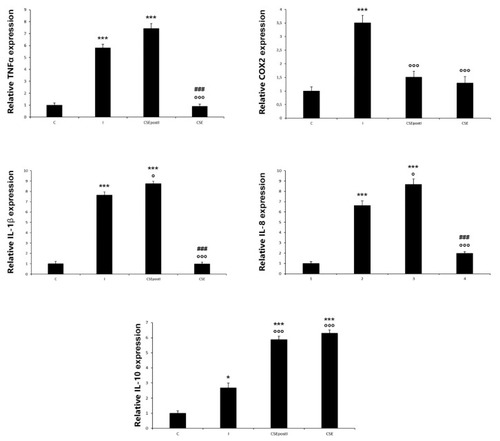
Relative expression of TNFα, COX2, IL-1β, IL-8 and IL-10 genes in control zebrafish (C), inflamed zebrafish (I), inflamed zebrafish post-treated with chestnut shell extract (CSEpostI) and zebrafish fed chestnut shell extract (CSE). Values are presented as the mean ± SEM. n= 6. *** p < 0.0001, * p < 0.05 compared to control group. °°° p < 0.0001, ° p < 0.05 compared to the inflamed group. ### p < 0.0001 compared to the CSEpostI group. |

Intestinal microbiota analysis by culture-dependent methods in zebrafish fed on a standard control diet and proinflammatory and polyphenolic diets. The experiments were conducted in triplicate. Results are expressed as Log CFU g-1 and reported as mean ± standard deviation. Asterisks indicate the statistical significance validated by One-Way ANOVA test with Dunnet correction (* p < 0.05; ** p < 0.01; *** p < 0.001; **** p < 0.0001), compared to the Control group. The absence of asterisks indicates no significance. C, control group; I, inflamed group; CSE, chestnut shell extract group; CSEpostI, chestnut shell extract administered post inflammation group. |
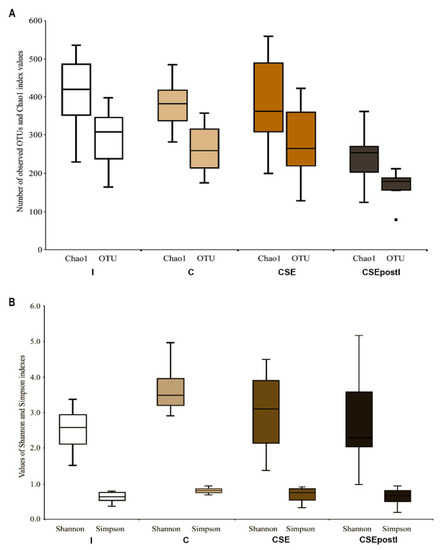
(A) Richness (number of observed OTUs and Chao1 index values) and (B) diversity (Shannon and Simpson indexes) estimates of bacterial communities from intestine of control zebrafish (C), inflamed zebrafish (I), inflamed zebrafish post-treated with chestnut shell extract (CSEpostI) and zebrafish fed chestnut shell extract (CSE). |

Gut microbiota community composition from intestine of control zebrafish (C), Inflamed zebrafish (I), inflamed zebrafish post-treated with chestnut shell extract (CSEpostI) and zebrafish fed chestnut shell extract (CSE) at phylum ( |
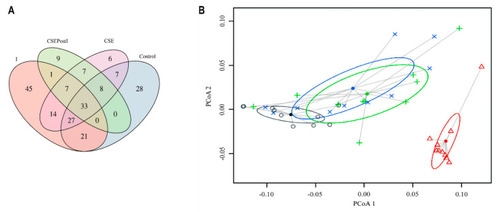
( |