
|
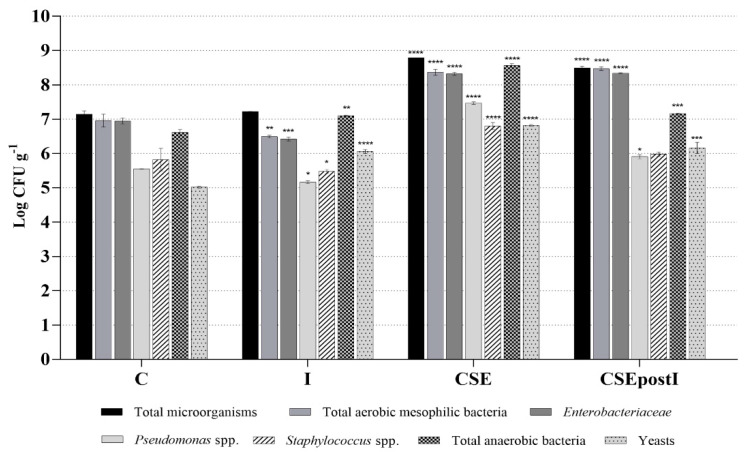
Figure 5 Intestinal microbiota analysis by culture-dependent methods in zebrafish fed on a standard control diet and proinflammatory and polyphenolic diets. The experiments were conducted in triplicate. Results are expressed as Log CFU g-1 and reported as mean ± standard deviation. Asterisks indicate the statistical significance validated by One-Way ANOVA test with Dunnet correction (* p < 0.05; ** p < 0.01; *** p < 0.001; **** p < 0.0001), compared to the Control group. The absence of asterisks indicates no significance. C, control group; I, inflamed group; CSE, chestnut shell extract group; CSEpostI, chestnut shell extract administered post inflammation group.