
Figure 1
- ID
- ZDB-FIG-210628-37
- Publication
- Orso et al., 2021 - Chestnut Shell Tannins: Effects on Intestinal Inflammation and Dysbiosis in Zebrafish
- Other Figures
- All Figure Page
- Back to All Figure Page
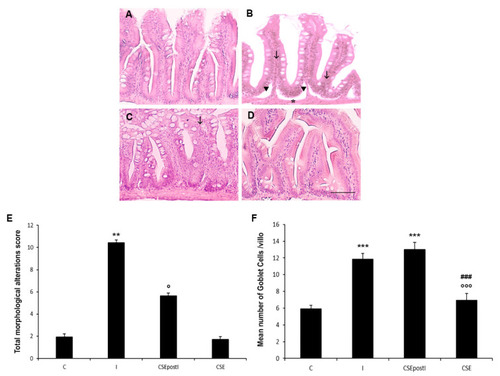
Haematoxylin-eosin (H&E) staining of MI of (A) control zebrafish (C), (B) inflamed zebrafish (I), (C) inflamed zebrafish post-treated with chestnut shell extract (CSEpostI) and (D) zebrafish fed chestnut shell extract (CSE). Scale bar: 100 µm. Arrows indicate leucocytes infiltrates, arrowheads indicate ragged villi, asterisks indicate mucosal thinning. (E) Bar graph showing the total intestinal alteration score defined for each zebrafish group. Data are expressed as mean ±SE. ** p < 0.001 compared to the control group; ° p < 0.05 compared to the inflamed group. (F) Bar graph showing the number of goblet cells in the MI of C, I, CSEpostI and CSE. Goblet cells were counted based on Alcian Blue staining. Data are expressed as mean ±SE. *** p < 0.0001 compared to the control group; °°° p < 0.0001 compared to the inflamed group; ### p < 0.0001 compared to the CSEpostI group. |