
Image
|
Figure Caption
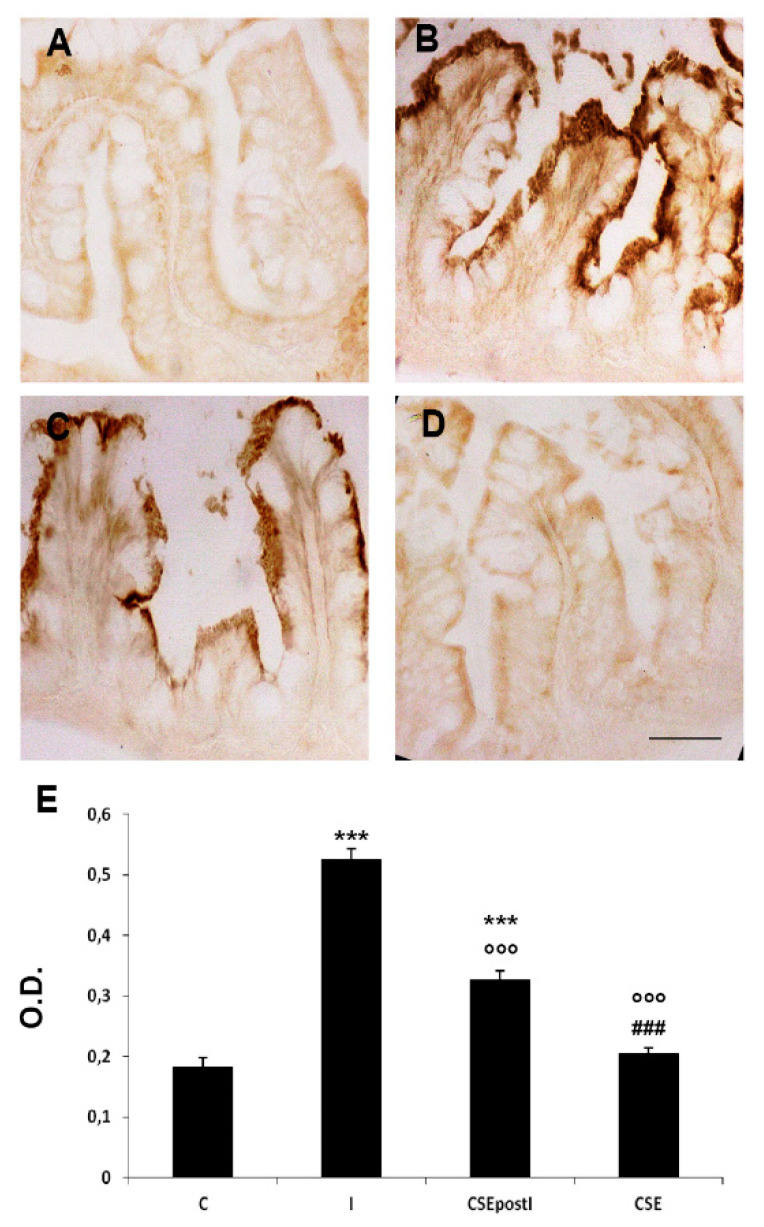
Figure 3 COX2 immunostaining in the MI of (A) control zebrafish (C), (B) inflamed zebrafish (I), (C) inflamed zebrafish post-treated with chestnut shell extract (CSEpostI) and (D) zebrafish fed chestnut shell extract (CSE). Scale bar: 50 µm. (E) Bar graph showing COX2 optical density (O.D.) in the MI of control, inflamed, CSEpostI and CSE zebrafish. Data are expressed as mean ±SE. *** p < 0.0001 compared to control group; °°° p < 0.0001 compared to the inflamed group; ### p < 0.0001 compared to the CSEpostI group.
Acknowledgments
This image is the copyrighted work of the attributed author or publisher, and
ZFIN has permission only to display this image to its users.
Additional permissions should be obtained from the applicable author or publisher of the image.
Full text @ Animals (Basel)