FIGURE SUMMARY
Title

Whole brain functional recordings at cellular resolution in zebrafish larvae with 3D scanning multiphoton microscopy

Authors
Bruzzone, M., Chiarello, E., Albanesi, M., Miletto Petrazzini, M.E., Megighian, A., Lodovichi, C., Dal Maschio, M.
Source
Full text @ Sci. Rep.

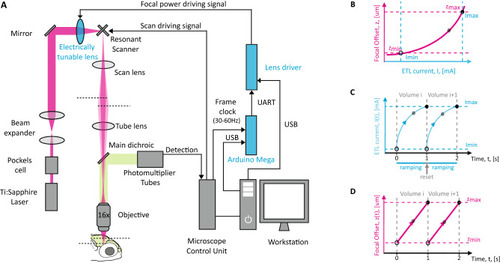
The layout of the optical configuration and the properties of the ETL. (A) Implementation of the electrically tunable lens along the optical path, the lens driver and the microcontroller (blue components). The image was generated using Adobe Illustrator CS2 (https://adobe.com/products/illustrator). (B) The ETL Look-Up-Table (LUT). Relationship between the input current to the ETL (blue axis) and the change in the focus resulting at the level of the sample (magenta axis). (C) The ETL input current works in a quasi-sawtooth pattern. The pattern is composed of two phases. A ramping one, where the input current to the ETL is continuously increased according to the LUT; and a reset one, where the input current is reset to 0 mA. The cycle occurs every 30 frames. (D) At the level of the sample, this pattern is translated in a continuous and linear change of the focus.

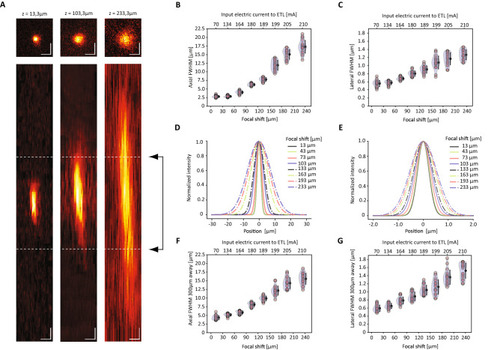
Optical performances of the system. (A) Average intensity projections (upper row with top-view XY, lower row with side view ZX) of the point spread function (PSF) measured at 920 nm on 0.2 μm fluorescent beads at three different settings of the ETL tuning range, z = 13.3 μm, z = 103.3 μm and z = 233.3 μm. Highlighted with dashed lines is the typical cell size (6 μm). Scale bar = 1 μm. (B,C) Axial and lateral FWHM of the PSF as function of the ETL defocus and of the corresponding ETL driving current, for beads measured within 50 μm from the center of the FOV. (D,E) Axial and lateral intensity profile of the PSF for beads measured within 50 μm from the center, corresponding to eight different settings of the ETL. (F,G) Axial and lateral FWHM of the PSF as function of the ETL defocus and of the corresponding ETL driving current, for beads measured at 300 μm from the center of the FOV.

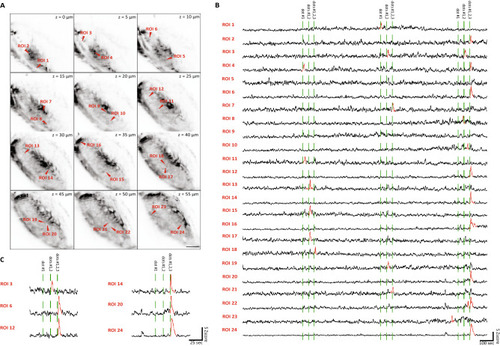
Multiplane calcium imaging of the RGC arborization fields. (A) Average intensity projections of the planes acquired across the RGC arborization fields. Red arrowheads indicate the regions of interest (ROIs) corresponding to single pixels identified. Scale bar = 20 μm. (B) The profiles of activity for the identified pixel in response to visual stimuli. Spikes with the peak exceeding a z-score of 5 are indicated in red. (C) Trace details of a subset ROIs during the last series of visual stimulations.

Whole brain calcium imaging. (A–C) Average intensity projections (left) and the results of the cell segmentation process (right) for a dorsal (A), central (B) and ventral (C) planes of the fish corresponding to the z-levels at + 150 μm, + 113 μm and + 0 μm, respectively. The colored boxes indicate the areas of the inset (A1C1). Scale bar = 50 μm. (A1–C1) Representative fields of view of the average intensity projections (left) and of the segmentation (right) extracted from (AC). Arrows indicate corresponding cell bodies. Scale bar = 10 μm. (D) Raster plot showing the activity profiles of the complete dataset of 47,992 neurons segmented as function of the time. The neurons corresponding to the (A1C1) insets are indicated in red. The grey trace at the bottom indicates the stimulation. (E) The activity profiles expressed as z-score for the neurons highlighted in (D). The vertical bars indicate the presentation of the looming stimulation. (F) Hierarchical clustering and raster heatmap of the 2400 stimulus-responding neurons identified with the regression analysis. For each cluster the average response is overlaid in the corresponding color. The grey trace at the bottom indicates the stimulation.

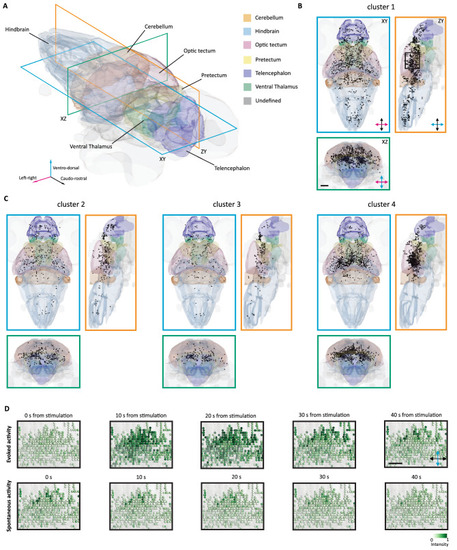
Anatomical representation of the identified clusters of visually responsive cells. (A) Three-dimensional representation of the brain of the larva with some of the most prominent region indicated. Three sectioning planes are overlaid to indicate the corresponding viewports for the following orthoviews. (B) Horizontal (cerulean), sagittal (orange) and coronal (bluish-green) views of the brain, with the projection of the stimulus-responsive cells belonging to the cluster 1. The black box indicates the area of the inset in D. Scale bar = 100 μm. (C) Horizontal, sagittal and coronal views of the brain, with the projection of the stimulus-responsive cells belonging to the cluster 2, 3 and 4. (D) Field of view extracted from the longitudinal plane in (B). In the top row, evoked activity of visually responsive cells is reported for 40 s from the onset of the stimulus. In the bottom row, spontaneous activity of the same cells is reported for 40 s. Scale bar = 50 μm.

Acknowledgments
This image is the copyrighted work of the attributed author or publisher, and ZFIN has permission only to display this image to its users. Additional permissions should be obtained from the applicable author or publisher of the image. Full text @ Sci. Rep.