IMAGE

Figure 4

ID
ZDB-IMAGE-210531-14
Source
Figures for Bruzzone et al., 2021
Image
Figure Caption

Figure 4

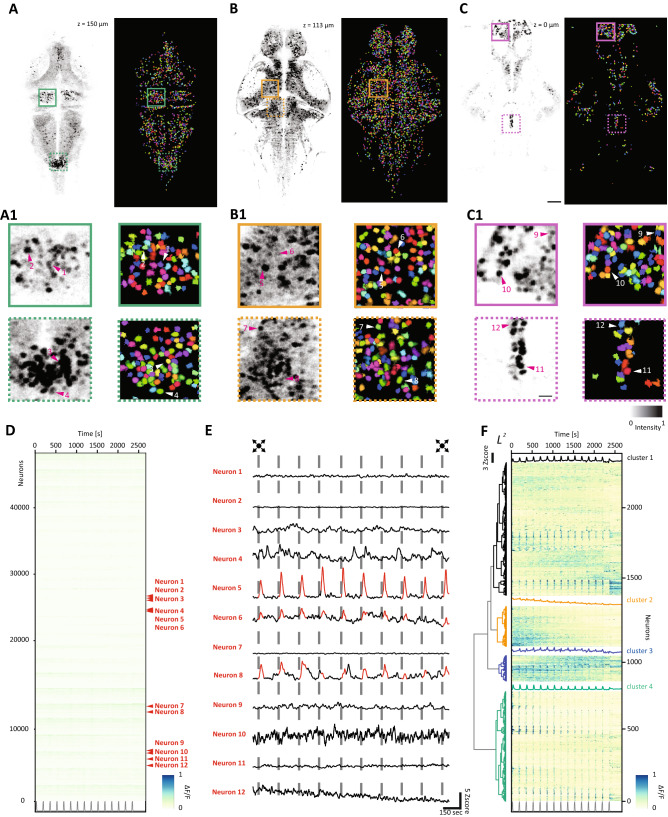
Whole brain calcium imaging. (A–C) Average intensity projections (left) and the results of the cell segmentation process (right) for a dorsal (A), central (B) and ventral (C) planes of the fish corresponding to the z-levels at + 150 μm, + 113 μm and + 0 μm, respectively. The colored boxes indicate the areas of the inset (A1C1). Scale bar = 50 μm. (A1–C1) Representative fields of view of the average intensity projections (left) and of the segmentation (right) extracted from (AC). Arrows indicate corresponding cell bodies. Scale bar = 10 μm. (D) Raster plot showing the activity profiles of the complete dataset of 47,992 neurons segmented as function of the time. The neurons corresponding to the (A1C1) insets are indicated in red. The grey trace at the bottom indicates the stimulation. (E) The activity profiles expressed as z-score for the neurons highlighted in (D). The vertical bars indicate the presentation of the looming stimulation. (F) Hierarchical clustering and raster heatmap of the 2400 stimulus-responding neurons identified with the regression analysis. For each cluster the average response is overlaid in the corresponding color. The grey trace at the bottom indicates the stimulation.

Acknowledgments
This image is the copyrighted work of the attributed author or publisher, and ZFIN has permission only to display this image to its users. Additional permissions should be obtained from the applicable author or publisher of the image. Full text @ Sci. Rep.