
Figure 2
- ID
- ZDB-FIG-210531-12
- Publication
- Bruzzone et al., 2021 - Whole brain functional recordings at cellular resolution in zebrafish larvae with 3D scanning multiphoton microscopy
- Other Figures
- All Figure Page
- Back to All Figure Page
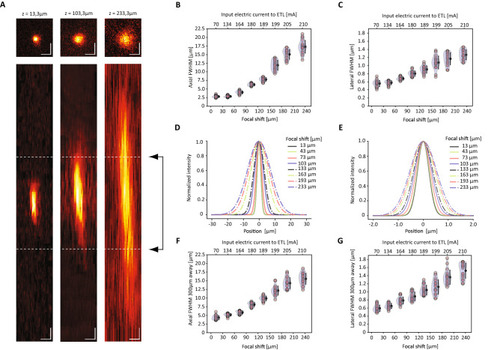
Optical performances of the system. (A) Average intensity projections (upper row with top-view XY, lower row with side view ZX) of the point spread function (PSF) measured at 920 nm on 0.2 μm fluorescent beads at three different settings of the ETL tuning range, z = 13.3 μm, z = 103.3 μm and z = 233.3 μm. Highlighted with dashed lines is the typical cell size (6 μm). Scale bar = 1 μm. (B,C) Axial and lateral FWHM of the PSF as function of the ETL defocus and of the corresponding ETL driving current, for beads measured within 50 μm from the center of the FOV. (D,E) Axial and lateral intensity profile of the PSF for beads measured within 50 μm from the center, corresponding to eight different settings of the ETL. (F,G) Axial and lateral FWHM of the PSF as function of the ETL defocus and of the corresponding ETL driving current, for beads measured at 300 μm from the center of the FOV. |