FIGURE

Figure 1

ID
ZDB-FIG-210531-11
Publication
Bruzzone et al., 2021 - Whole brain functional recordings at cellular resolution in zebrafish larvae with 3D scanning multiphoton microscopy
Other Figures
All Figure Page
Back to All Figure Page
Figure 1

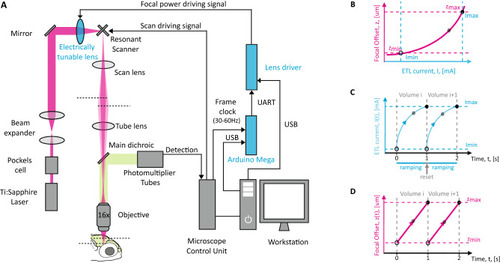
The layout of the optical configuration and the properties of the ETL. (A) Implementation of the electrically tunable lens along the optical path, the lens driver and the microcontroller (blue components). The image was generated using Adobe Illustrator CS2 (https://adobe.com/products/illustrator). (B) The ETL Look-Up-Table (LUT). Relationship between the input current to the ETL (blue axis) and the change in the focus resulting at the level of the sample (magenta axis). (C) The ETL input current works in a quasi-sawtooth pattern. The pattern is composed of two phases. A ramping one, where the input current to the ETL is continuously increased according to the LUT; and a reset one, where the input current is reset to 0 mA. The cycle occurs every 30 frames. (D) At the level of the sample, this pattern is translated in a continuous and linear change of the focus.

Expression Data

Expression Detail
Antibody Labeling
Phenotype Data

Phenotype Detail
Acknowledgments
This image is the copyrighted work of the attributed author or publisher, and ZFIN has permission only to display this image to its users. Additional permissions should be obtained from the applicable author or publisher of the image. Full text @ Sci. Rep.