
|
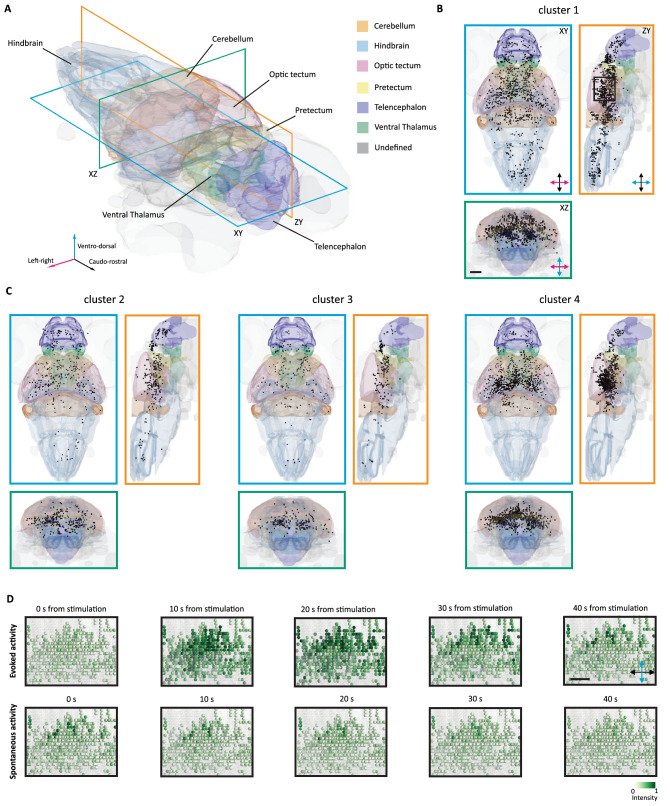
Figure 5 Anatomical representation of the identified clusters of visually responsive cells. (A) Three-dimensional representation of the brain of the larva with some of the most prominent region indicated. Three sectioning planes are overlaid to indicate the corresponding viewports for the following orthoviews. (B) Horizontal (cerulean), sagittal (orange) and coronal (bluish-green) views of the brain, with the projection of the stimulus-responsive cells belonging to the cluster 1. The black box indicates the area of the inset in D. Scale bar = 100 μm. (C) Horizontal, sagittal and coronal views of the brain, with the projection of the stimulus-responsive cells belonging to the cluster 2, 3 and 4. (D) Field of view extracted from the longitudinal plane in (B). In the top row, evoked activity of visually responsive cells is reported for 40 s from the onset of the stimulus. In the bottom row, spontaneous activity of the same cells is reported for 40 s. Scale bar = 50 μm.