Design of the zebrafish effluent exposure experiment. Exposures were conducted to a system water control (SWC), EE2 (10 ng/L) or WwTW effluent concentrations of 100% or 50% for the different developmental life stages indicated. Exposures are indicated with solid horizontal lines with dashed lines indicating fish maintenance in clean water. There were three replicate tanks per treatment. The time points for measurement of the different endpoints are indicated. From 0-4 dpf, embryos/larvae were housed in 500 mL glass dishes without any water flow at a density of 50 fish per dish and kept in an incubator at 28 °C. From 5-21 dpf, fish were kept in 3.5 L nursery tanks placed within the 20 L glass tanks and then subsequently transferred to the 20 L tanks at 21 dpf.
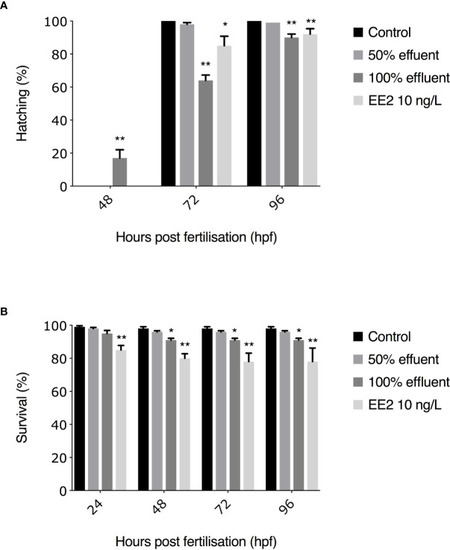
Hatching rates (A) and subsequent survival (B) to 96 hpf of ERE-GFP Casper zebrafish. Transgenic zebrafish embryos were exposed to EE2 (10 ng/L), a WwTW effluent concentration (50% or 100%) or dilution water control. Data are reported as mean ± SE. Asterisks denote a significant difference (*p ≤ 0.05, **p ≤ 0.01) compared with control.

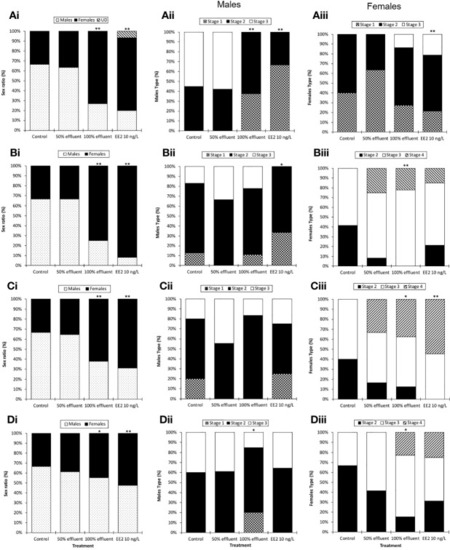
Sex ratios and male and female maturity index in ERE-GFP Casper zebrafish. Sex and indices of sexual maturity were measured in transgenic zebrafish at 60 dpf or 90 dpf following exposure to EE2 (10 ng/L), a WwTW effluent (at 100% or 50% dilution) or a dilution water control during the following developmental periods: (A) 0-90 days (data analysis at 60 dpf); (B) 0-90 days (data analysis at 90 dpf) (C) 21-60 days (data analysis at 60 dpf) and (D) 60-90 days (data analysis at 90 dpf). Data are reported as mean ± SE. Asterisks denote statistically significant differences (*p<0.05, **p<0.01) from expected sex/maturity index ratios according to a chi-square contingency table.

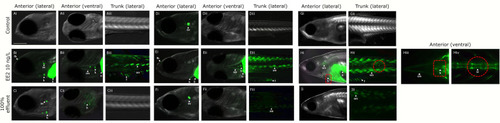
Expression of GFP in body tissues in ERE-GFP Casper zebrafish exposed to EE2 and undiluted WwTW effluent from 0-90 dpf. Transgenic zebrafish at 4 dpf in dilution water control (A), EE2 (10 ng/L, positive control, B), and wastewater effluent (100%) exposed groups (C); at 21 dpf in system water control, D), EE2 (10 ng/L, E) and 100% wastewater effluent (F); at 30 dpf in system water control (G), EE2 (10 ng/L, H) and 100% wastewater effluent (I). GFP expression is shown for regions in the head (lateral – i and ventral – ii views) and trunk (lateral view - iii). GFP induction was observed in the cranial muscles (cm), fin (f), forebrain (fb), heart (h), liver (li), otic vesicle (ov), skeletal bone (sc) and somite muscles (sm) in the EE2 exposed fish (B, E, H), and heart, liver and otic vesicle in wastewater effluent exposed fish (C, F, I). Bar = 100 μm.

gfp mRNA and vtg mRNA levels in ERE-TG Casper zebrafish. Levels of gfp mRNA and vtg mRNA were measured in transgenic zebrafish exposed to EE2 (10 ng/L) a WwTW effluent (50% or 100%) or system water control during the developmental periods of (A) 0-90 days, (B) 21-60 days, and (C) 60-90 days. Data are reported as mean ± SE and expressed as fold-change compared with the control. Relative mRNA expression was determined as the ratio or target gene mRNA/rpl8 mRNA. Asterisks denote a significant difference (*p ≤ 0.05, **p ≤ 0.01, *** p ≤ 0.001) compared with control. Within groups, different letters denote a significant difference (p ≤ 0.05).

Correlation between gfp and vtg mRNA expression in ERE-GFP Casper zebrafish for different life stage exposure periods. Transgenic zebrafish were exposed to (i) EE2 (10 ng/L) or (ii) a graded effluent (50% and 100%) during the following developmental periods: (A) 0-90 days, (B) 21-60 days, and (C) 60-90 day. Data are reported as mean ± SE and expressed as fold-change compared with the control. Relative mRNA expression was determined as the ratio of target gene mRNA/rpl8 mRNA.

Acknowledgments
This image is the copyrighted work of the attributed author or publisher, and ZFIN has permission only to display this image to its users. Additional permissions should be obtained from the applicable author or publisher of the image. Full text @ Front Endocrinol (Lausanne)