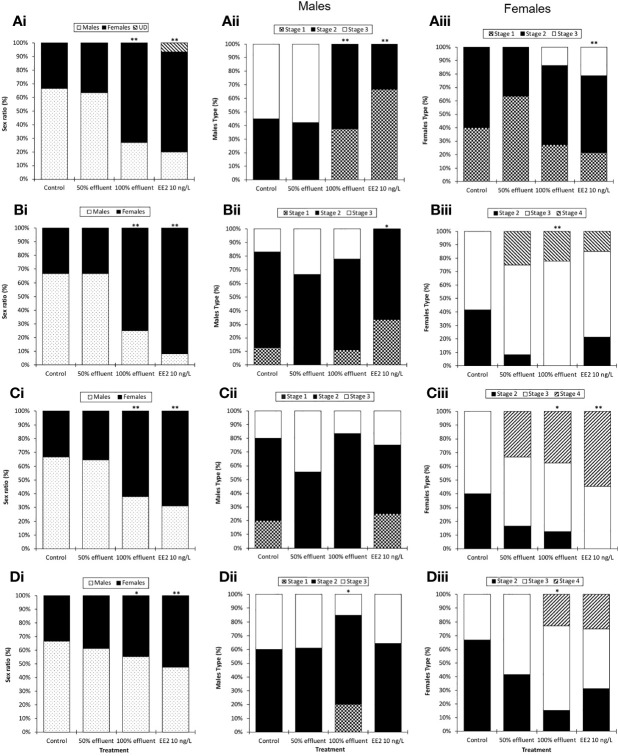
IMAGE

Figure 3

ID
ZDB-IMAGE-210520-32
Source
Figures for Cooper et al., 2021
Image
Figure Caption

Figure 3

Sex ratios and male and female maturity index in ERE-GFP Casper zebrafish. Sex and indices of sexual maturity were measured in transgenic zebrafish at 60 dpf or 90 dpf following exposure to EE2 (10 ng/L), a WwTW effluent (at 100% or 50% dilution) or a dilution water control during the following developmental periods: (A) 0-90 days (data analysis at 60 dpf); (B) 0-90 days (data analysis at 90 dpf) (C) 21-60 days (data analysis at 60 dpf) and (D) 60-90 days (data analysis at 90 dpf). Data are reported as mean ± SE. Asterisks denote statistically significant differences (*p<0.05, **p<0.01) from expected sex/maturity index ratios according to a chi-square contingency table.

Acknowledgments
This image is the copyrighted work of the attributed author or publisher, and ZFIN has permission only to display this image to its users. Additional permissions should be obtained from the applicable author or publisher of the image. Full text @ Front Endocrinol (Lausanne)