FIGURE

Figure 4

ID
ZDB-FIG-210520-33
Publication
Cooper et al., 2021 - Health Effects and Life Stage Sensitivities in Zebrafish Exposed to an Estrogenic Wastewater Treatment Works Effluent
Other Figures
All Figure Page
Back to All Figure Page
Figure 4

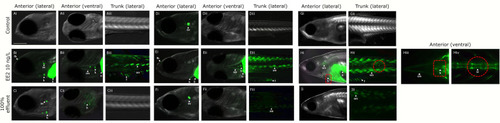
Expression of GFP in body tissues in ERE-GFP Casper zebrafish exposed to EE2 and undiluted WwTW effluent from 0-90 dpf. Transgenic zebrafish at 4 dpf in dilution water control (A), EE2 (10 ng/L, positive control, B), and wastewater effluent (100%) exposed groups (C); at 21 dpf in system water control, D), EE2 (10 ng/L, E) and 100% wastewater effluent (F); at 30 dpf in system water control (G), EE2 (10 ng/L, H) and 100% wastewater effluent (I). GFP expression is shown for regions in the head (lateral – i and ventral – ii views) and trunk (lateral view - iii). GFP induction was observed in the cranial muscles (cm), fin (f), forebrain (fb), heart (h), liver (li), otic vesicle (ov), skeletal bone (sc) and somite muscles (sm) in the EE2 exposed fish (B, E, H), and heart, liver and otic vesicle in wastewater effluent exposed fish (C, F, I). Bar = 100 μm.

Expression Data

Expression Detail
Antibody Labeling
Phenotype Data

Phenotype Detail
Acknowledgments
This image is the copyrighted work of the attributed author or publisher, and ZFIN has permission only to display this image to its users. Additional permissions should be obtained from the applicable author or publisher of the image. Full text @ Front Endocrinol (Lausanne)