
- Title
-
Vandetanib versus Cabozantinib in Medullary Thyroid Carcinoma: A Focus on Anti-Angiogenic Effects in Zebrafish Model
- Authors
- Carra, S., Gaudenzi, G., Dicitore, A., Saronni, D., Cantone, M.C., Plebani, A., Ghilardi, A., Borghi, M.O., Hofland, L.J., Persani, L., Vitale, G.
- Source
- Full text @ Int. J. Mol. Sci.
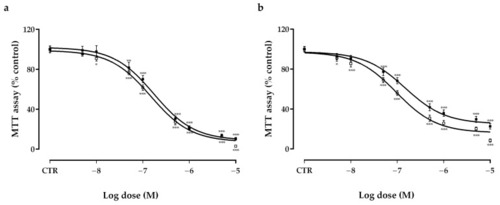
Effects of vandetanib (VAN) (□) and cabozantinib (CAB) (■) on cell viability in TT (a) and MZ-CRC-1 (b) cell lines measured using an MTT assay. Cells were incubated for six days with vehicle (control), or with the drug at different concentrations, as described in the Material and Methods. Dose response curves were expressed as a nonlinear regression (curve fit) of log (concentration drug) versus the percentage of the control. Values represent the mean ± S.E.M. of at least three independent experiments in six replicates. Control (CTR) values have been set to 100%. * p < 0.05; ** p < 0.01; *** p < 0.001. |
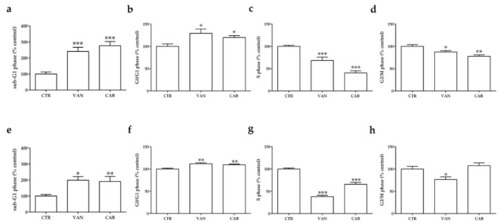
Effects of vandetanib (VAN) and cabozantinib (CAB) on the cell cycle in medullary thyroid carcinoma (MTC) cell lines. Cell cycle analysis after six days of incubation with VAN and CAB in TT (a–d) and MZ-CRC-1 cell lines (e–h). Cells were detected using FACS analysis after staining with propidium iodide. Control (CTR) values have been set to 100%. Cell cycle distribution is expressed as the percentage of cells in the G0/G1, S, and G2/M phases compared to the untreated CTR. Values represent the mean ± S.E.M. of at least three independent experiments. * p < 0.05; ** p < 0.01; *** p < 0.001. |

Effects of vandetanib (VAN) and cabozantinib (CAB) on apoptosis in medullary thyroid carcinoma (MTC) cell lines. Cell death analysis after six days of incubation with VAN and CAB in TT (a–c) and MZ-CRC-1 cell lines (d–f) through flow cytometry with Annexin V and propidium iodine. The proportions of cells in early apoptosis (a,d), late apoptosis (b,e) and necrosis (c,f) were expressed as the percentage compared with the untreated control (CTR) and represent the mean ± S.E.M. of at least three independent experiments. * p < 0.05; ** p < 0.01; *** p < 0.001. |

Anti-angiogenic effect of vandetanib (VAN) and cabozantinib (CAB) on the physiological development of the zebrafish sub-intestinal vein (SIV) plexus. Representative fluorescence images of the SIV basket of 72 hpf Tg(fli1a:EGFP)y1 zebrafish embryos treated for 24 h with dimethyl sulfoxide (DMSO) (a), 5 × 10⁻⁶ M VAN (b) and CAB (c). Following 24 h of VAN (d) and CAB (e) treatments at different concentrations, the number of vertical vessels comprising the SIV basket was counted and compared with that of the control (CTR) embryos. Graphed values represent the mean ± S.E.M. *** p < 0.001 versus the CTR. Embryos are shown anterior to the left. |
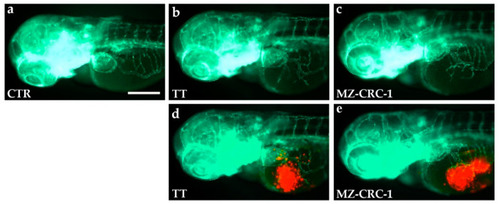
TT and MZ-CRC-1 implanted cells stimulate angiogenesis in zebrafish embryos after only 24 h post-injection. Representative fluorescence images of 72 hpf Tg(fli1a:EGFP)y1 zebrafish control embryos (a) and embryos implanted at 48 hpf with TT (b,d) and MZ-CRC-1 cells (c,e). The red channel, corresponding to TT or MZ-CRC-1 cells, was omitted in panels b and c to highlight the tumor-induced microvascular network. Compared to the control, grafted embryos showed vessels in green that sprout from the sub-intestinal vein (SIV) toward the xenograft of both cell lines. Embryos are shown anterior to the left. Scale bar: 100 µm. |

Effect of vandetanib (VAN) and cabozantinib (CAB) treatments on tumor-induced angiogenesis after TT cell xenograft in zebrafish embryos. Representative fluorescence images of 72 hpf |
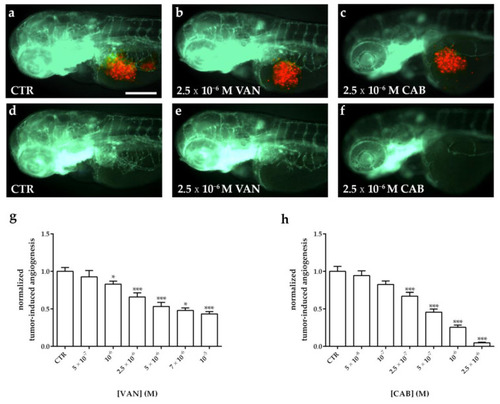
Effect of vandetanib (VAN) and cabozantinib (CAB) treatments on tumor-induced angiogenesis after MZ-CRC-1 cell xenograft in zebrafish embryos. Representative fluorescence images of 72 hpf Tg(fli1a:EGFP)y1 zebrafish embryos implanted at 48 hpf with MZ-CRC-1 cells and subsequently treated for 24 h with dimethyl sulfoxide (DMSO) (a,d), VAN (b,e) and CAB (c,f). The red channel, corresponding to MZ-CRC-1 cells, was omitted in panels d, e, and f to highlight the tumor-induced microvascular network. Grafted larvae showed vessels in green that sprout from the sub-intestinal vein (SIV) toward the xenograft. Quantification of tumor-induced angiogenesis in MZ-CRC-1-injected Tg(fli1a:EGFP)y1 embryos after 24 h of VAN (g) and CAB (h) treatments at different concentrations. Control (CTR) values have been set to 1.0. Graphed values represent the mean ± S.E.M. * p < 0.05 versus the CTR; *** p < 0.001 versus the CTR. Embryos are shown anterior to the left. Scale bar: 100 µm. |