
FIGURE
Figure 2
- ID
- ZDB-FIG-210409-237
- Publication
- Carra et al., 2021 - Vandetanib versus Cabozantinib in Medullary Thyroid Carcinoma: A Focus on Anti-Angiogenic Effects in Zebrafish Model
- Other Figures
- All Figure Page
- Back to All Figure Page
Figure 2
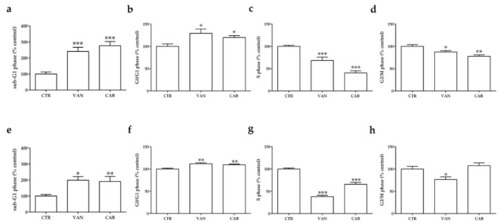
Effects of vandetanib (VAN) and cabozantinib (CAB) on the cell cycle in medullary thyroid carcinoma (MTC) cell lines. Cell cycle analysis after six days of incubation with VAN and CAB in TT (a–d) and MZ-CRC-1 cell lines (e–h). Cells were detected using FACS analysis after staining with propidium iodide. Control (CTR) values have been set to 100%. Cell cycle distribution is expressed as the percentage of cells in the G0/G1, S, and G2/M phases compared to the untreated CTR. Values represent the mean ± S.E.M. of at least three independent experiments. * p < 0.05; ** p < 0.01; *** p < 0.001. |
Expression Data
Expression Detail
Antibody Labeling
Phenotype Data
Phenotype Detail
Acknowledgments
This image is the copyrighted work of the attributed author or publisher, and
ZFIN has permission only to display this image to its users.
Additional permissions should be obtained from the applicable author or publisher of the image.
Full text @ Int. J. Mol. Sci.