
|
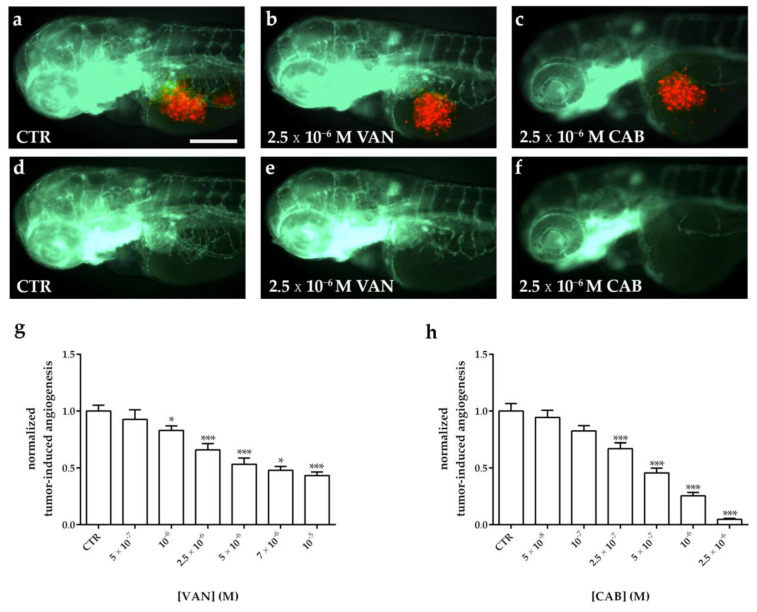
Figure 7 Effect of vandetanib (VAN) and cabozantinib (CAB) treatments on tumor-induced angiogenesis after MZ-CRC-1 cell xenograft in zebrafish embryos. Representative fluorescence images of 72 hpf Tg(fli1a:EGFP)y1 zebrafish embryos implanted at 48 hpf with MZ-CRC-1 cells and subsequently treated for 24 h with dimethyl sulfoxide (DMSO) (a,d), VAN (b,e) and CAB (c,f). The red channel, corresponding to MZ-CRC-1 cells, was omitted in panels d, e, and f to highlight the tumor-induced microvascular network. Grafted larvae showed vessels in green that sprout from the sub-intestinal vein (SIV) toward the xenograft. Quantification of tumor-induced angiogenesis in MZ-CRC-1-injected Tg(fli1a:EGFP)y1 embryos after 24 h of VAN (g) and CAB (h) treatments at different concentrations. Control (CTR) values have been set to 1.0. Graphed values represent the mean ± S.E.M. * p < 0.05 versus the CTR; *** p < 0.001 versus the CTR. Embryos are shown anterior to the left. Scale bar: 100 µm.