
Figure 1
- ID
- ZDB-FIG-210409-236
- Publication
- Carra et al., 2021 - Vandetanib versus Cabozantinib in Medullary Thyroid Carcinoma: A Focus on Anti-Angiogenic Effects in Zebrafish Model
- Other Figures
- All Figure Page
- Back to All Figure Page
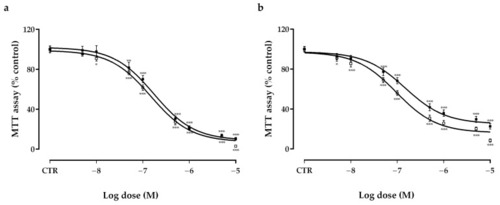
Effects of vandetanib (VAN) (□) and cabozantinib (CAB) (■) on cell viability in TT (a) and MZ-CRC-1 (b) cell lines measured using an MTT assay. Cells were incubated for six days with vehicle (control), or with the drug at different concentrations, as described in the Material and Methods. Dose response curves were expressed as a nonlinear regression (curve fit) of log (concentration drug) versus the percentage of the control. Values represent the mean ± S.E.M. of at least three independent experiments in six replicates. Control (CTR) values have been set to 100%. * p < 0.05; ** p < 0.01; *** p < 0.001. |