FIGURE SUMMARY
Title

Upregulation of the pathogenic transcription factor SPI1/PU.1 in tuberous sclerosis complex and focal cortical dysplasia by oxidative stress

Authors
Zimmer, T.S., Korotkov, A., Zwakenberg, S., Jansen, F.E., Zwartkruis, F.J.T., Rensing, N.R., Wong, M., Mühlebner, A., van Vliet, E.A., Aronica, E., Mills, J.D.
Source
Full text @ Brain Pathol

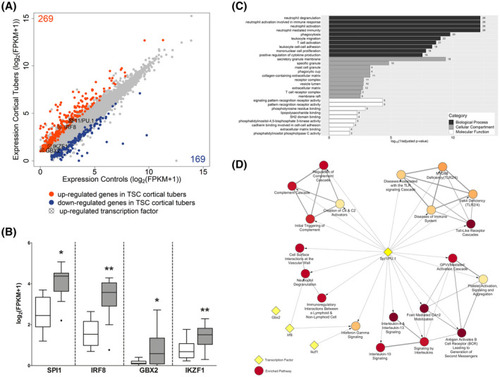
Identification of SPI1, IRF8, GBX2, and IKZF1 as novel transcription factors in TSC cortical tuber. Differential expression analysis of cortical tuber tissue versus age‐matched cortical control samples derived from autopsy revealed 269 upregulated (orange) and 169 downregulated (blue) genes. Four potentially important transcriptional regulators were identified from the upregulated genes (cross circle) (A). Comparison of log2FPKM values from cortical tuber tissue versus age‐matched cortical control tissue from autopsy (B). GO enrichment analysis of the top 10 enriched pathways of 139 genes predicted to be targeted by SPI1/PU.1 identified predominantly immune system‐associated GO terms (C). Reactome pathway enrichment analysis of the upregulated genes from RNA Seq revealed SPI1/PU.1 to target multiple genes in the top 20 most enriched pathway. IRF8 targeted 2 pathways, while GBX2 and IKZF1 targeted only 1 pathway. All pathways shown here have an adjusted p‐value < 0.007, with the yellow nodes indicating higher p‐values and lower p‐values indicated by dark red nodes (D). (B) Data presented as Tukey's box plot. RNA Seq n = 10 autopsy control cortex samples versus n = 12 TSC cortical tubers. Statistical test used: modified t test

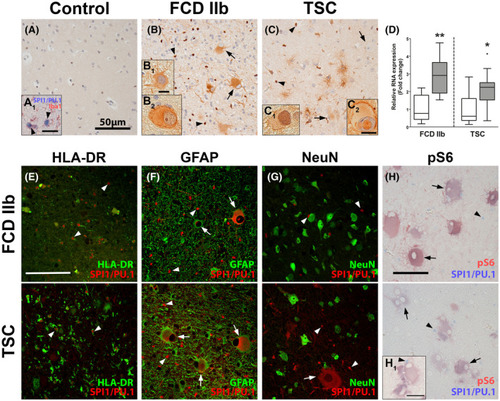
SPI1/PU.1 is highly expressed in malformed cells in TSC and FCD 2b lesions. Autopsy control cortex showed SPI1/PU.1 expression solely in microglia (A, A1). In TSC and FCD 2b expression of SPI1/PU.1 was found in microglia (arrowheads) but also malformed cells and dysmorphic neurons (arrows) (B, B1, C). Moreover, SPI1/PU.1 expression could also be found in the nuclei of malformed cells (B2, C1, C2). Analysis of RNA expression in tissue from resected TSC tuber and FCD 2b lesion of an independent cohort showed higher expression of SPI1 compared to control (D). Co‐labeling with cell markers HLA‐DR, GFAP, and NeuN revealed SPI1/PU.1 expression in microglial nuclei (arrowheads) and GFAP+NeuN malformed cells (arrows) in FCD 2b and TSC tissue (E–G). Moreover, malformed cells displayed nuclear SPI1/PU.1 expression (arrows in F). Co‐labeling with pS6 showed consistent co‐localization with SPI1/PU.1 in malformed cells (H, H1). Sections A–C were counterstained with hematoxylin. Scale bars: 50 µm in A, E, H, 5 µm in insert B1 (representative for B2, C1), 10 µm in C2, H1; arrows = malformed cells, arrowheads = microglia. D Mann–Whitney U test. Data are expressed relative to expression observed in autopsy controls and displayed as Tukey's box plot; * p < 0.05, ** p < 0.01. n = 8 autopsy control (for both FCD 2b and TSC control groups) versus n = 10 TSC and n = 8 FCD 2b samples

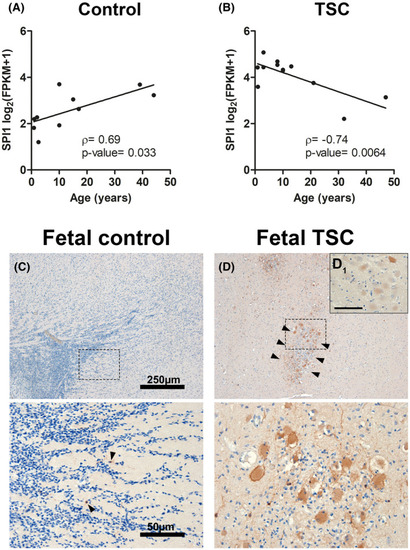
SPI1/PU.1 expression in malformed cells occurs early in TSC development. SPI1 expression displayed a significant positive correlation with age in control samples (A). In contrast, TSC tuber tissue displayed a negative correlation with age samples (Pearson's correlation) (B). Fetal control cortex displayed sparse SPI1/PU.1 expression solely in few microglia (arrowheads in magnified lower panel) (C). Fetal TSC cases revealed strong expression of SPI1/PU.1 in malformed cells that could be found in subcortical clusters (arrowheads, magnified in lower panel) (D). SPI1/PU.1 expression was found to be variable between malformed cells (D1). Sections C and D were counterstained with hematoxylin. Scale bars: 250 µm in upper panel and 50 µm in C (representative for D), 25 µm in D1; A, B Spearman's rank correlation test (displayed with Spearman correlation coefficient ρ and exact p‐value)

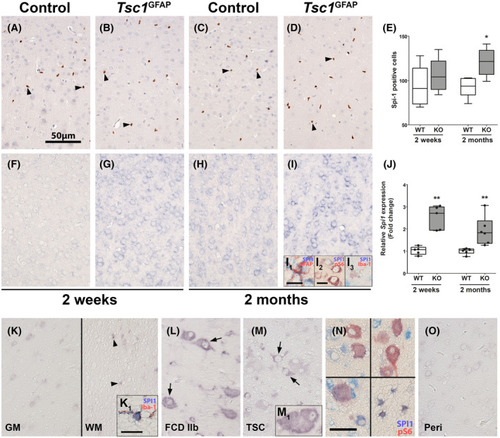
Spi1/Pu.1 RNA expression in the cortex is elevated in Tsc1GFAP−/− mice, while protein expression increases with microglial cell number. Antibody staining against Spi1/Pu.1‐expressing cells in the cortex of Tsc1GFAP−/− mice was not different in 2‐week‐old animals between WT and KO and restricted to microglia (A, B). In contrast, the number of Spi1/Pu.1‐expressing cells was higher in KO animals at 2 months (C, D). Quantification of Spi1/Pu.1‐expressing cells in the cortex confirmed higher Spi1/Pu.1‐positive cell count in 2‐month‐old Tsc1GFAP−/− animals (E). In situ hybridization against Spi1 in the cortex of Tsc1GFAP−/− mice showed higher expression of Spi1 at 2 weeks of age in all cell types before seizure development compared to age‐matched animals, where expression was absent (F, G). In 2‐month‐old animals Spi1 expression appeared higher in control animals compared to 2‐week‐old mice (H). In 2‐month‐old animals that suffered from spontaneous recurrent seizures, very strong Spi1 expression could be detected in astrocytes, microglia, and pS6‐positive neurons (I, I1‐3). Quantification of total Spi1 RNA confirmed higher Spi1 RNA expression in Tsc1GFAP−/− animals compared to age‐matched littermates (J). In situ hybridization in human autopsy tissue revealed very weak expression in cortical neurons, and mostly cells with microglial morphology, as confirmed by co‐labeling with Iba‐1 (K, K1). SPI1 in FCD 2b lesions and TSC tubers could be found in malformed cells (L, M, M1). Moreover, SPI1 co‐localized with pS6 expression in malformed cells, but also cells with astrocyte morphology (N). Peri‐lesional tissue displayed expression similar to autopsy control tissue (O). Sections A–D were counterstained with hematoxylin. Scale bars: 50 µm in A (representative for B‐D, F‐I, K‐M, O), 25 µm in N, 15 µm in I2, 10 µm in I1 (representative for I3) and K1 (representative for M1) arrowheads in A = microglia, arrowheads in K = glia, arrows in L, M = malformed cells. E, J Mann–Whitney U test. Data are expressed relative to expression observed in age‐matched wild‐type controls and displayed as Tukey's box plots; * p < 0.05, ** p < 0.01. n = 5 wild‐type animals versus n = 6 Tsc1GFAP−/− mice

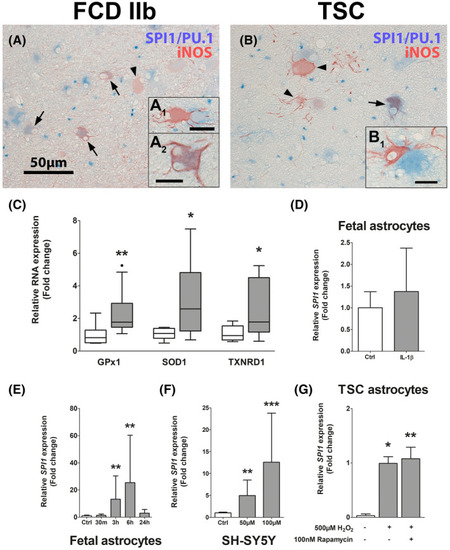
Oxidative stress is present in malformed cells in TSC cortical tubers and stimulates SPI1 expression in vitro. Expression of iNOS could be detected exclusively in malformed cells in FCD 2b and TSC tissue. Co‐localization of SPI/PU.1 and iNOS was found in some malformed cells (arrows in A, B and A2). Moreover, iNOS expression was often found in cells that were in close proximity to SPI1/PU.1‐expressing cells (A1, B1) that wrapped around each other (A, B). Analysis of the OS markers GPx1, SOD1, and TXNRD1 showed higher expression in TSC tissue compared to control (C). Human fetal astrocytes did not display higher SPI1 expression when exposed to IL‐1β, but H2O2 in a time‐dependent manner (D, E). SH‐SY5Y neuroblastoma cells exposed to H2O2 displayed SPI1 induction, similar to astrocytes (F). In vitro, TSC‐derived astrocytes displayed higher expression of SPI1 when exposed to H2O2, which was independent of mTOR inhibition via rapamycin (G). Scale bars: 50 µm in A, 25 µm in A1, 20 µm in B1, 10 µm in A2, arrowheads = iNOS single positive cells, arrows = co‐localized cells. (C and D) Mann–Whitney U test. (E–G) Kruskal–Wallis test with Dunn's post hoc. (C) Data are expressed relative to expression in autopsy control and displayed as Tukey's box plot. (D–G) Data are expressed as bar graphs with SD; *p < 0.05, **p < 0.01, ***p < 0.001. (C) n = 8 autopsy control versus n = 10 TSC samples. (D–G) n = 3 independent cultures in duplicates

Acknowledgments
This image is the copyrighted work of the attributed author or publisher, and ZFIN has permission only to display this image to its users. Additional permissions should be obtained from the applicable author or publisher of the image. Full text @ Brain Pathol