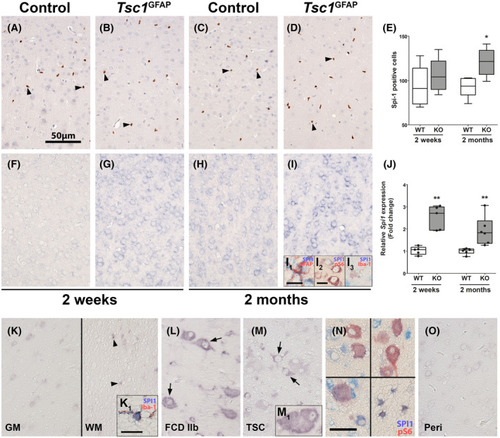
Spi1/Pu.1 RNA expression in the cortex is elevated in Tsc1GFAP−/− mice, while protein expression increases with microglial cell number. Antibody staining against Spi1/Pu.1‐expressing cells in the cortex of Tsc1GFAP−/− mice was not different in 2‐week‐old animals between WT and KO and restricted to microglia (A, B). In contrast, the number of Spi1/Pu.1‐expressing cells was higher in KO animals at 2 months (C, D). Quantification of Spi1/Pu.1‐expressing cells in the cortex confirmed higher Spi1/Pu.1‐positive cell count in 2‐month‐old Tsc1GFAP−/− animals (E). In situ hybridization against Spi1 in the cortex of Tsc1GFAP−/− mice showed higher expression of Spi1 at 2 weeks of age in all cell types before seizure development compared to age‐matched animals, where expression was absent (F, G). In 2‐month‐old animals Spi1 expression appeared higher in control animals compared to 2‐week‐old mice (H). In 2‐month‐old animals that suffered from spontaneous recurrent seizures, very strong Spi1 expression could be detected in astrocytes, microglia, and pS6‐positive neurons (I, I1‐3). Quantification of total Spi1 RNA confirmed higher Spi1 RNA expression in Tsc1GFAP−/− animals compared to age‐matched littermates (J). In situ hybridization in human autopsy tissue revealed very weak expression in cortical neurons, and mostly cells with microglial morphology, as confirmed by co‐labeling with Iba‐1 (K, K1). SPI1 in FCD 2b lesions and TSC tubers could be found in malformed cells (L, M, M1). Moreover, SPI1 co‐localized with pS6 expression in malformed cells, but also cells with astrocyte morphology (N). Peri‐lesional tissue displayed expression similar to autopsy control tissue (O). Sections A–D were counterstained with hematoxylin. Scale bars: 50 µm in A (representative for B‐D, F‐I, K‐M, O), 25 µm in N, 15 µm in I2, 10 µm in I1 (representative for I3) and K1 (representative for M1) arrowheads in A = microglia, arrowheads in K = glia, arrows in L, M = malformed cells. E, J Mann–Whitney U test. Data are expressed relative to expression observed in age‐matched wild‐type controls and displayed as Tukey's box plots; * p < 0.05, ** p < 0.01. n = 5 wild‐type animals versus n = 6 Tsc1GFAP−/− mice
|
