FIGURE

FIGURE 2

ID
ZDB-FIG-210906-2
Publication
Zimmer et al., 2021 - Upregulation of the pathogenic transcription factor SPI1/PU.1 in tuberous sclerosis complex and focal cortical dysplasia by oxidative stress
Other Figures
All Figure Page
Back to All Figure Page
FIGURE 2

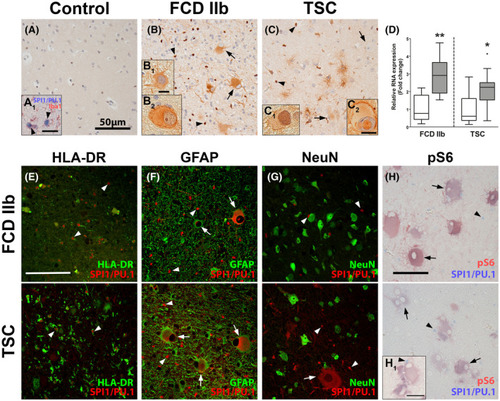
SPI1/PU.1 is highly expressed in malformed cells in TSC and FCD 2b lesions. Autopsy control cortex showed SPI1/PU.1 expression solely in microglia (A, A1). In TSC and FCD 2b expression of SPI1/PU.1 was found in microglia (arrowheads) but also malformed cells and dysmorphic neurons (arrows) (B, B1, C). Moreover, SPI1/PU.1 expression could also be found in the nuclei of malformed cells (B2, C1, C2). Analysis of RNA expression in tissue from resected TSC tuber and FCD 2b lesion of an independent cohort showed higher expression of SPI1 compared to control (D). Co‐labeling with cell markers HLA‐DR, GFAP, and NeuN revealed SPI1/PU.1 expression in microglial nuclei (arrowheads) and GFAP+NeuN malformed cells (arrows) in FCD 2b and TSC tissue (E–G). Moreover, malformed cells displayed nuclear SPI1/PU.1 expression (arrows in F). Co‐labeling with pS6 showed consistent co‐localization with SPI1/PU.1 in malformed cells (H, H1). Sections A–C were counterstained with hematoxylin. Scale bars: 50 µm in A, E, H, 5 µm in insert B1 (representative for B2, C1), 10 µm in C2, H1; arrows = malformed cells, arrowheads = microglia. D Mann–Whitney U test. Data are expressed relative to expression observed in autopsy controls and displayed as Tukey's box plot; * p < 0.05, ** p < 0.01. n = 8 autopsy control (for both FCD 2b and TSC control groups) versus n = 10 TSC and n = 8 FCD 2b samples

Expression Data

Expression Detail
Antibody Labeling
Phenotype Data

Phenotype Detail
Acknowledgments
This image is the copyrighted work of the attributed author or publisher, and ZFIN has permission only to display this image to its users. Additional permissions should be obtained from the applicable author or publisher of the image. Full text @ Brain Pathol