
|
FIGURE 1
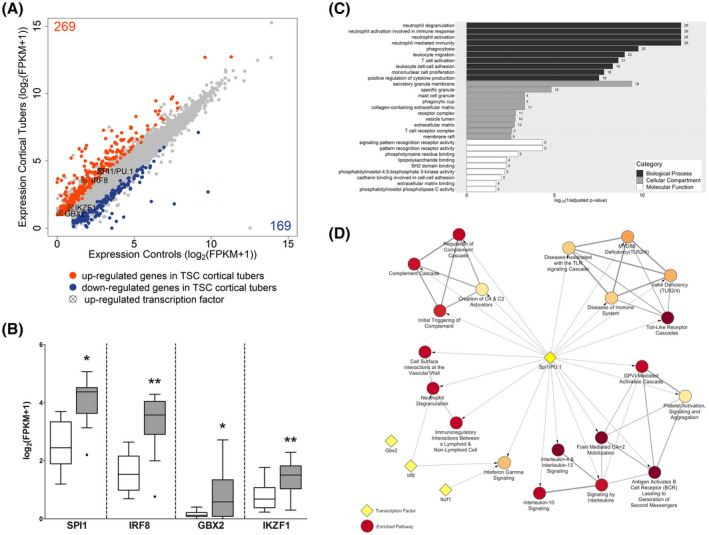
Identification of SPI1, IRF8, GBX2, and IKZF1 as novel transcription factors in TSC cortical tuber. Differential expression analysis of cortical tuber tissue versus age‐matched cortical control samples derived from autopsy revealed 269 upregulated (orange) and 169 downregulated (blue) genes. Four potentially important transcriptional regulators were identified from the upregulated genes (cross circle) (A). Comparison of log2FPKM values from cortical tuber tissue versus age‐matched cortical control tissue from autopsy (B). GO enrichment analysis of the top 10 enriched pathways of 139 genes predicted to be targeted by SPI1/PU.1 identified predominantly immune system‐associated GO terms (C). Reactome pathway enrichment analysis of the upregulated genes from RNA Seq revealed SPI1/PU.1 to target multiple genes in the top 20 most enriched pathway. IRF8 targeted 2 pathways, while GBX2 and IKZF1 targeted only 1 pathway. All pathways shown here have an adjusted