(A) Zebrafish were stained with o-dianisidine in the control group, model group (AA 40 µmol/L), aspirin group (AA 40 µmol/L + aspirin 22.5 µg/ml), and XST group (AA 40 µmol/L + XST 400 µg/ml), RBCs in heart were marked by red dashed lines, caudal venous thrombus were guided by red arrows; (B) quantitative analysis measured the intensity of RBCs of zebrafish in heart area. The error bars represent the standard deviation of means, n = 10. All data were expressed by the mean ± SD, ##p < 0.01 vs. control group; **p < 0.01, *p < 0.05 vs. model group.

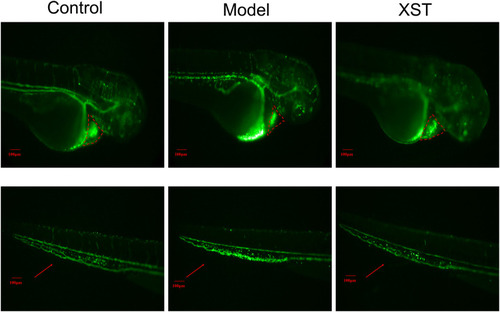
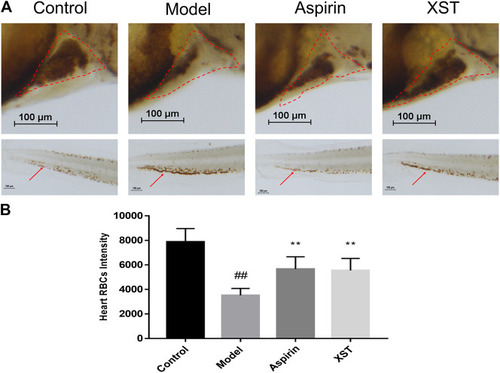
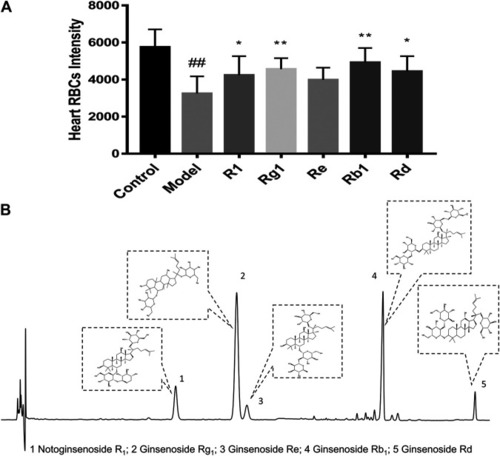
Transgenic LCR-GFP zebrafish in the control group, model group (AA 40 µmol/L), and XST group (AA 40 µmol/L + XST 400 µg/ml), RBCs in heart were marked by red dashed lines, caudal venous thrombus were guided by red arrows. n = 10.

(A) Zebrafish were stained with o-dianisidine in the control group, model group (AA 40 µmol/L), and XST groups of different concentrations (AA 40 µmol/L + XST 200, 240, 280, 320, 360, and 400 μg/ml), RBCs in heart were marked by red dashed lines; (B) quantitative analysis measured the intensity of RBCs of zebrafish in the control group, model group (AA 40 µmol/L), and XST groups of different concentrations (AA 40 µmol/L + XST 200, 240, 280, 320, 360, and 400 μg/ml) in the heart area. The error bars represent the standard deviation of means, n = 10. All data were expressed by the mean ± SD, ##p < 0.01 vs. control group; **p < 0.01, *p < 0.05 vs. model group.

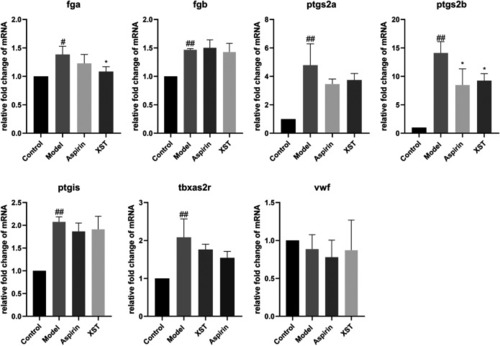
Relative fold change of mRNA of fga, fgb, ptgs2a, ptgs2b, ptgis, tbxa2r, and vwf in the control group, model group (AA 40 µmol/L), aspirin group (AA 40 µmol/L + aspirin 22.5 µg/ml), and XST group (AA 40 µmol/L + XST 400 µg/ml), n = 20. All data were expressed by the mean ± SD, ##p < 0.01, #p < 0.05 vs. control group; *p < 0.05 vs. model group.

(A) Quantitative analysis measured the intensity of RBCs of zebrafish in the control group, model group (AA 40 µmol/L), R1 group (AA 40 µmol/L + notoginsenoside R1 200 µmol/L), Rg1 group (AA 40 µmol/L + ginsenoside Rg1 200 µmol/L), Re group (AA 40 µmol/L + ginsenoside Re 200 µmol/L), Rb1 group (AA 40 µmol/L+ ginsenoside Rb1 200 µmol/L), and Rd group (AA 40 µmol/L + ginsenoside Rd 100 µmol/L). Quantitative analysis was executed to measure the intensity of RBCs of zebrafish in the heart area. The error bars represent the standard deviation of means, n = 10. All data were expressed by the mean ± SD, ##p < 0.01 vs. control group; **p < 0.01, *p < 0.05 vs. model group; (B) HPLC chromatography of XST and chemical structural formulas of notoginsenoside R1, ginsenoside Rg1, ginsenoside Re, ginsenoside Rb1, and ginsenoside Rd.

(A) The chromatograms of XST; (B) content analysis results of notoginsenoside R1, ginsenoside Rg1, ginsenoside Re, ginsenoside Rb1, and ginsenoside Rd of two batches of XST; (C) representative images of two batches of XST treated thrombotic zebrafish, RBCs were marked by red dashed lines; (D) inhibition rates of two batches of XST.

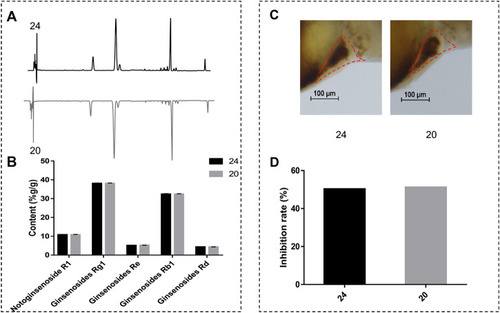
(A) The distinction between area normalization percent content and inhibition rates of 24 normal batches of XST and five abnormal batches of XST. (B) The distinction between the inhibition rates of 24 normal batches of XST and five abnormal batches of XST.

Acknowledgments
This image is the copyrighted work of the attributed author or publisher, and ZFIN has permission only to display this image to its users. Additional permissions should be obtained from the applicable author or publisher of the image. Full text @ Front Pharmacol