
Image
|
Figure Caption
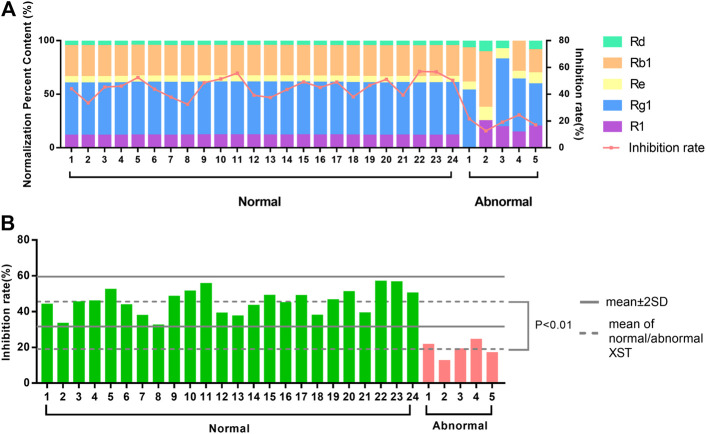
FIGURE 7 (A) The distinction between area normalization percent content and inhibition rates of 24 normal batches of XST and five abnormal batches of XST. (B) The distinction between the inhibition rates of 24 normal batches of XST and five abnormal batches of XST.
Acknowledgments
This image is the copyrighted work of the attributed author or publisher, and
ZFIN has permission only to display this image to its users.
Additional permissions should be obtained from the applicable author or publisher of the image.
Full text @ Front Pharmacol