
Image
|
Figure Caption
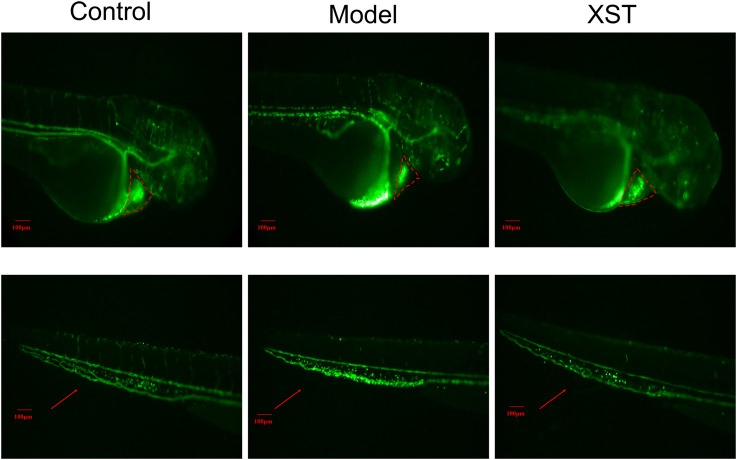
FIGURE 2
Transgenic LCR-GFP zebrafish in the control group, model group (AA 40 µmol/L), and XST group (AA 40 µmol/L + XST 400 µg/ml), RBCs in heart were marked by red dashed lines, caudal venous thrombus were guided by red arrows. n = 10.
Acknowledgments
This image is the copyrighted work of the attributed author or publisher, and
ZFIN has permission only to display this image to its users.
Additional permissions should be obtained from the applicable author or publisher of the image.
Full text @ Front Pharmacol