|
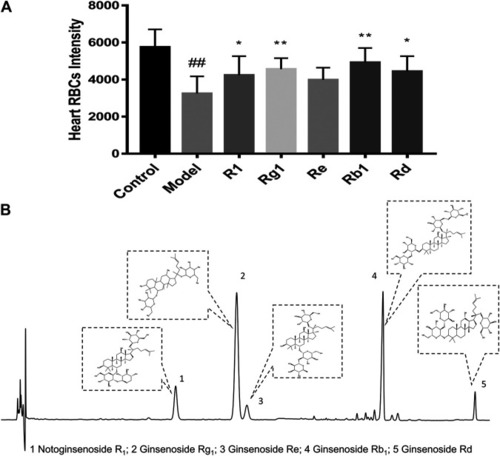
(A) Quantitative analysis measured the intensity of RBCs of zebrafish in the control group, model group (AA 40 µmol/L), R1 group (AA 40 µmol/L + notoginsenoside R1 200 µmol/L), Rg1 group (AA 40 µmol/L + ginsenoside Rg1 200 µmol/L), Re group (AA 40 µmol/L + ginsenoside Re 200 µmol/L), Rb1 group (AA 40 µmol/L+ ginsenoside Rb1 200 µmol/L), and Rd group (AA 40 µmol/L + ginsenoside Rd 100 µmol/L). Quantitative analysis was executed to measure the intensity of RBCs of zebrafish in the heart area. The error bars represent the standard deviation of means, n = 10. All data were expressed by the mean ± SD, ##p < 0.01 vs. control group; **p < 0.01, *p < 0.05 vs. model group; (B) HPLC chromatography of XST and chemical structural formulas of notoginsenoside R1, ginsenoside Rg1, ginsenoside Re, ginsenoside Rb1, and ginsenoside Rd.
|