|
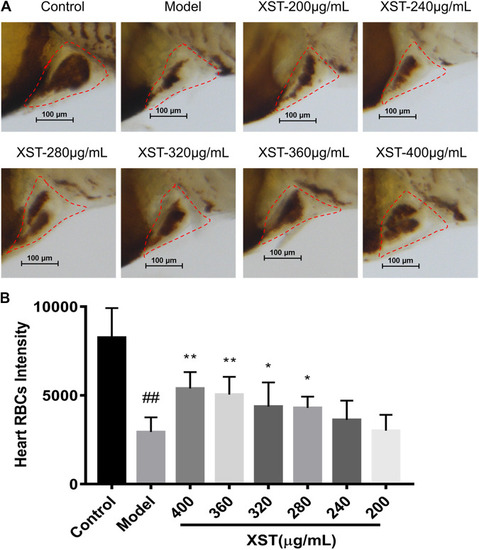
(A) Zebrafish were stained with o-dianisidine in the control group, model group (AA 40 µmol/L), and XST groups of different concentrations (AA 40 µmol/L + XST 200, 240, 280, 320, 360, and 400 μg/ml), RBCs in heart were marked by red dashed lines; (B) quantitative analysis measured the intensity of RBCs of zebrafish in the control group, model group (AA 40 µmol/L), and XST groups of different concentrations (AA 40 µmol/L + XST 200, 240, 280, 320, 360, and 400 μg/ml) in the heart area. The error bars represent the standard deviation of means, n = 10. All data were expressed by the mean ± SD, ##p < 0.01 vs. control group; **p < 0.01, *p < 0.05 vs. model group.
|