
- Title
-
The Bdkrb2 gene family provides a novel view of viviparity adaptation in Sebastes schlegelii
- Authors
- Niu, J., Song, W., Li, R., Yu, H., Guan, J., Qi, J., He, Y.
- Source
- Full text @ BMC Ecol Evol
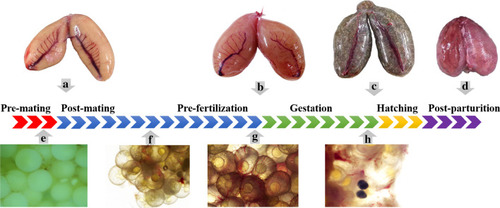
Macroscopic and microcosmic observation of the ovary at different stages of reproductive process. |

Schematic diagram of gene location and protein structure. modified by PyMol software. Models in line a were shown as cartoon style. Models in line a’ were shown as dot style |
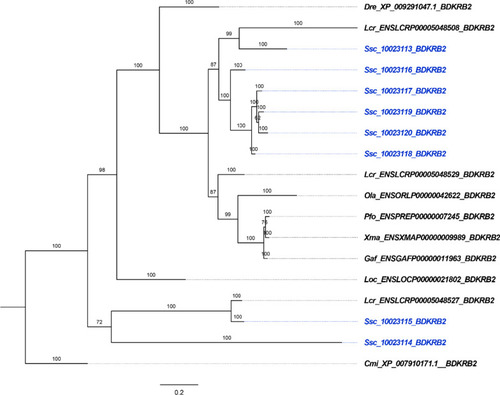
Phylogenetic analysis of |

Tissue expression pattern of |

Functional study of |

Expression pattern of Bdkrb2 genes in the ovary in the reproductive cycle. a Heatmap was constructed by comparing three kinds of samples at different stage of the reproductive cycle. The x‐axis shows sampled tissues with the prefix C. for connective tissue rich in blood vessels covering the egg membrane and E. for embryos and O. for ovarian wall. Arabic numerals represent different stages. 1, pre-fertilization; 2, 1-cell; 3, 8-cells; 4, 16-cells; 5, gastrula stage; 6, 8-somites stage; 7, tailbud stage; 8, pre-hatching; 9, hatching. The color scale shows standardized TPM values normalized by Z-score method |