
Image
|
Figure Caption
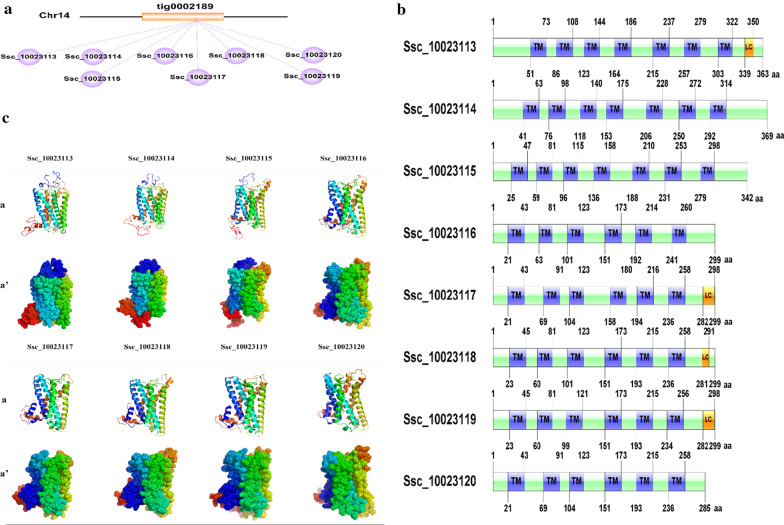
Fig. 2
Schematic diagram of gene location and protein structure.
modified by PyMol software. Models in line a were shown as cartoon style. Models in line a’ were shown as dot style
Acknowledgments
This image is the copyrighted work of the attributed author or publisher, and
ZFIN has permission only to display this image to its users.
Additional permissions should be obtained from the applicable author or publisher of the image.
Full text @ BMC Ecol Evol