FIGURE SUMMARY
Title

PAK4 methylation by the methyltransferase SETD6 attenuates cell adhesion

Authors
Vershinin, Z., Feldman, M., Levy, D.
Source
Full text @ Sci. Rep.

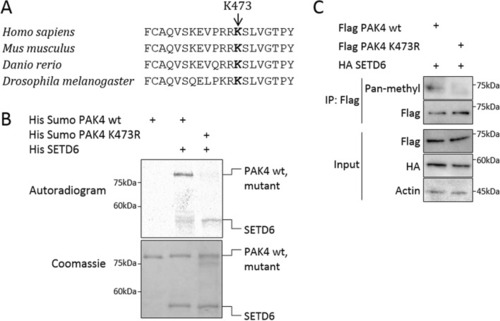
SETD6 methylates PAK4 at lysine 473. (A) A multiple alignment of lysine 473 residue of PAK4 in different organisms. Multiple alignment was performed using COBALT tool55 for Homo sapiens, Mus musculus, Danio rerio and Drosophila melanogaster PAK4 protein sequences. (B) In-vitro methylation assay. Recombinant His-Sumo-PAK4 wild-type (wt) or the His-Sumo-PAK4 K473R mutant were incubated with or without His-SETD6 in the presence of 3H-labeled SAM. Proteins were then subjected to SDS-PAGE followed by exposure to autoradiogram to detect 3H-labeled proteins or Coomassie staining to detect all proteins. (C) Methylation assay in cells. MDA-MB-231 wild-type cells were transfected with Flag PAK4 wild-type or Flag PAK4 K473R, and both with HA SETD6 plasmids. Cell lysates were immunoprecipitated (IP) with FLAG-M2 beads, and proteins in IP and input samples were detected by Western blot with indicated antibodies. Methylation was detected with pan-methyl antibody. Uncropped gels are shown in Supplementary Fig. S9.

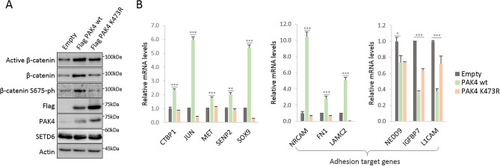
Methylated PAK4 at lysine 473 upregulates Wnt/β-catenin target genes. (A) Cell extracts of MDA-MB-231 cells stably expressing empty plasmid, Flag PAK4 wild-type or Flag PAK4 K473R mutant were subjected to Western blot to detect endogenous protein levels of β-catenin, active (non-phospho) β-catenin and β-catenin S675-ph. Uncropped gels are shown in Supplementary Fig. S9. (B) mRNA was extracted from MDA-MB-231 cells stably expressing empty plasmid, Flag PAK4 wild-type or Flag PAK4 K473R. Transcript levels of the indicated Wnt/β-catenin target genes were determined by qPCR. mRNA levels were normalized to GAPDH and then to empty cells. Error bars are s.e.m. Statistical analysis was performed for 3 experimental repeats using one-way ANOVA. *p < 0.05, **p < 0.01, ***p < 0.001.

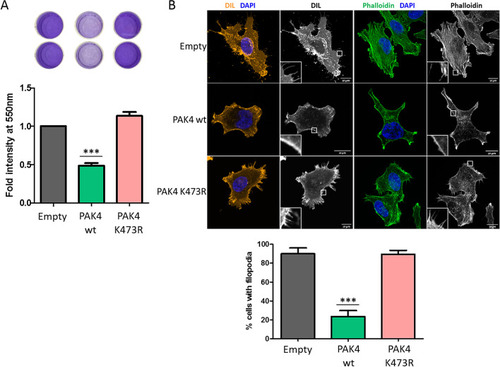
PAK4 K473me decreases adhesion of the cells and modulates cell morphology. (A) Cell adhesion to fibronectin. MDA-MB-231 cells stably expressing empty plasmid, Flag PAK4 wild-type or Flag PAK4 K473R were serum starved over-night. Cells were then plated on a fibronectin pre-coated 96-well plate, followed by crystal violet staining. Crystal violet staining was solubilized and quantified. Error bars are s.d. Statistical analysis was performed for 5 experimental repeats using one-way ANOVA. ***p < 0.001. (B) Filopodia and cell actin structures staining. MDA-MB-231 cells stably expressing empty plasmid, Flag PAK4 wild-type or Flag PAK4 K473R were fixed and stained with Vybrant™ DiI Cell-Labeling Solution (on the left) or phalloidin (on the right) and Hoechst or DAPI. Cells were then visualized by confocal microscopy (63×). Scale bar 10 µm. Graph on the bottom shows percent cells with filopodia manually counted. Error bars are s.d. Statistical analysis was performed for n > 32 cells per condition using one-way ANOVA. ***p < 0.001.

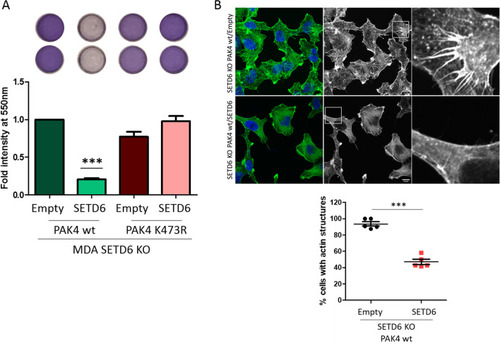
Cell adhesion properties are SETD6 dependent. (A) Cell adhesion to fibronectin. MDA-MB-231 CRISPR SETD6 knock-out (MDA SETD6 KO) cells stably expressing Flag PAK4 wild-type or Flag PAK4 K473R with empty or Flag SETD6 were serum starved over-night. Cells were then plated on a fibronectin pre-coated 96-well plate, followed by crystal violet staining. Crystal violet staining was solubilized and quantified. Error bars are s.d. Statistical analysis was performed for 3 experimental repeats using one-way ANOVA. ***p < 0.001, significance for PAK4 wild-type with Flag SETD6 compared to all other conditions. (B) Actin structures staining. MDA-MB-231 CRISPR SETD6 knock-out (SETD6 KO) cells stably expressing Flag PAK4 wild-type with empty or Flag SETD6, were fixed and stained with phalloidin and DAPI and visualized by a confocal microscope (40×). Scale bar 10 µm. Graph on the bottom shows percent cells with actin structures manually counted. Error bars are s.d. Statistical analysis was performed for n > 49 cells per condition using Student’s t-test. ***p < 0.001.

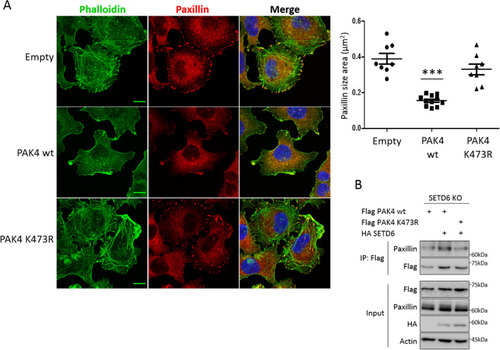
PAK4 K473me attenuates paxillin localization to focal adhesions. (A) MDA-MB-231 cells stably expressing empty plasmid, Flag PAK4 wild-type or Flag PAK4 K473R were fixed and stained with phalloidin (green), paxillin (red) and DAPI. Cells were visualized by a confocal microscope (63×). Scale bar 10 µm. Graph on the right represents the paxillin area size. Error bars are s.d. Statistical analysis was performed for n > 44 cells per condition using one-way ANOVA. ***p < 0.001. (B) MDA-MB-231 CRISPR SETD6 knock-out (SETD6 KO) cells were transfected with Flag PAK4 wild-type or Flag PAK4 K473R, with or without HA SETD6. Samples were immunoprecipitated with FLAG-M2 beads and submitted to Western blot with anti-paxillin antibody. Uncropped gels are shown in Supplementary Fig. S9.

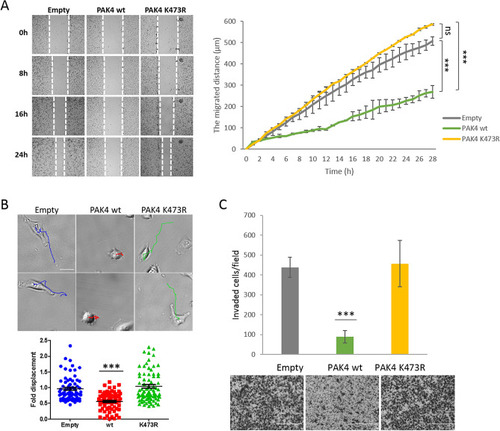
Unmethylated PAK4 promotes cell migration and cell invasion. (A) Migration assay. Confluent MDA-MB-231 cell cultures stably expressing empty plasmid, Flag PAK4 wild-type or Flag PAK4 K473R were serum starved before producing the scratch wound by dragging a 200 μl pipette tip across the layer of cells. Migration distance of the cells was monitored by a Lionheart™ FX Automated Microscope (4×). On the left, representative images of the cells at 0, 8, 16 and 24 h after producing the scratch, with white dashed lines indicating the wound borders. Error bars are s.d. Statistical analysis represents the last 21 time points (from 8 to 28 h of the experiment) using two-way ANOVA. ***p < 0.001, ns, not significant. Representative figure of 3 independent experiments. (B) Single cell migration assay. Approximately 5,000 MDA-MB-231 cells stably expressing empty plasmid, Flag PAK4 wild-type or Flag PAK4 K473R were plated and serum starved for over-night. Then, Hoechst stain was added and single cell motility was tracked for 4 h and analyzed by TrackMate (Fiji) software. The migration tracks of the cells are indicated in blue (empty), red (PAK4 wild-type) and green (PAK4 K473R). Scale bar 30 µm. The graph represents fold displacement of the cells relative to empty. Error bars are s.d. Statistical analysis was performed for n > 70 cells using one-way ANOVA. ***p < 0.001. The figure is accompanied with 6 movies in the supplementary data Movies S1-6. (C) Invasion assay. MDA-MB-231 cells stably expressing empty plasmid, Flag PAK4 wild-type or Flag PAK4 K473R were serum starved, then added to the matrigel pre-coated inserts. After 24 h, invaded cells were stained with Dipp Kwik Differential Stain and visualized by EVOS FL Cell Imaging System and analyzed using Fiji software. The graph represents invaded cell counted per field. For each sample 5 fields were analyzed. Error bars are s.d. Statistical analysis was performed for 3 experimental repeats using one-way ANOVA. ***p < 0.001. Representative images of the invaded and stained cells at the bottom. Scale bar 400 µm.

Acknowledgments
This image is the copyrighted work of the attributed author or publisher, and ZFIN has permission only to display this image to its users. Additional permissions should be obtained from the applicable author or publisher of the image. Full text @ Sci. Rep.