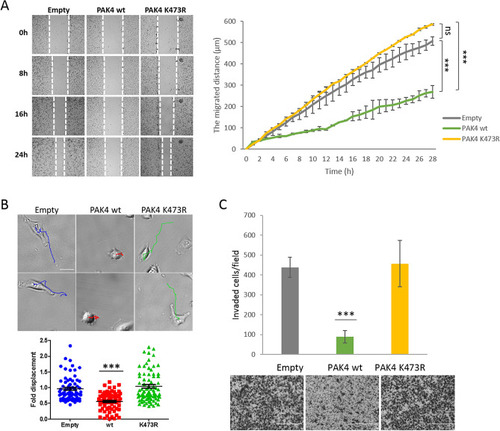
Unmethylated PAK4 promotes cell migration and cell invasion. (A) Migration assay. Confluent MDA-MB-231 cell cultures stably expressing empty plasmid, Flag PAK4 wild-type or Flag PAK4 K473R were serum starved before producing the scratch wound by dragging a 200 μl pipette tip across the layer of cells. Migration distance of the cells was monitored by a Lionheart™ FX Automated Microscope (4×). On the left, representative images of the cells at 0, 8, 16 and 24 h after producing the scratch, with white dashed lines indicating the wound borders. Error bars are s.d. Statistical analysis represents the last 21 time points (from 8 to 28 h of the experiment) using two-way ANOVA. ***p < 0.001, ns, not significant. Representative figure of 3 independent experiments. (B) Single cell migration assay. Approximately 5,000 MDA-MB-231 cells stably expressing empty plasmid, Flag PAK4 wild-type or Flag PAK4 K473R were plated and serum starved for over-night. Then, Hoechst stain was added and single cell motility was tracked for 4 h and analyzed by TrackMate (Fiji) software. The migration tracks of the cells are indicated in blue (empty), red (PAK4 wild-type) and green (PAK4 K473R). Scale bar 30 µm. The graph represents fold displacement of the cells relative to empty. Error bars are s.d. Statistical analysis was performed for n > 70 cells using one-way ANOVA. ***p < 0.001. The figure is accompanied with 6 movies in the supplementary data Movies S1-6. (C) Invasion assay. MDA-MB-231 cells stably expressing empty plasmid, Flag PAK4 wild-type or Flag PAK4 K473R were serum starved, then added to the matrigel pre-coated inserts. After 24 h, invaded cells were stained with Dipp Kwik Differential Stain and visualized by EVOS FL Cell Imaging System and analyzed using Fiji software. The graph represents invaded cell counted per field. For each sample 5 fields were analyzed. Error bars are s.d. Statistical analysis was performed for 3 experimental repeats using one-way ANOVA. ***p < 0.001. Representative images of the invaded and stained cells at the bottom. Scale bar 400 µm.
|
