
- Title
-
Rapamycin relieves the cataract caused by ablation of Gja8b through stimulating autophagy in zebrafish
- Authors
- Ping, X., Liang, J., Shi, K., Bao, J., Wu, J., Yu, X., Tang, X., Zou, J., Shentu, X.
- Source
- Full text @ Autophagy
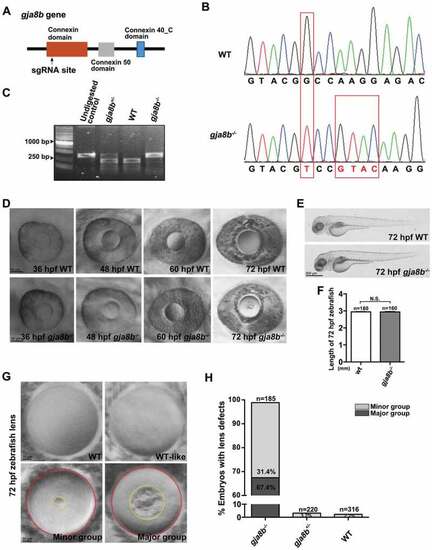
Ablation of Gja8b induces cataracts in zebrafish. (A) Schematic illustration of the position (amino acid 136) of the gja8b gene edited by sgRNA. (B) Sanger sequencing results showed that 1 base pair (bp) was substituted and 4 bp were inserted in gja8b mutant zebrafish, causing the loss of the recognition site for the restriction enzyme StyI. The genome editing led to a truncated Gja8b proteins (amino acid 1–136 followed by 22 mistranslated amino acids). (C) The gja8b mutant zebrafish were genotyped with PCR, which was followed by StyI digestion. The undigested WT PCR products was loaded as a control. The PCR products of WT fish (386 bp) could be digested with StyI to generate two fragments (236 bp and 150 bp). The PCR products of homozygous gja8b mutants could not be digested with StyI. (D) Ablation of Gja8b induced cataracts in zebrafish at 72 hpf. (E and F) Ablation of Gja8b did not affect the overall development of zebrafish. (E) Shows the WT and gja8b mutant larvae at 72 hpf. (F) Statistical analysis of length of larvae at 72 hpf (n ≥ 160 zebrafish for each group). (G and H) The cataract phenotypes displayed various severities in individual gja8b mutant zebrafish at 72 hpf. (H) Shows the statistical analysis of (G). In total, 1.2% of gja8b mutants did not display defects, 31.4% displayed light defects (Minor group), and 67.4% displayed severe defects in lenses (Major group). Yellow circles mark the opacity area in gja8b mutant lens, red circles mark the whole lens. The gja8b mutant embryos with an opaque ratio between the opaque area and the whole lens area is smaller than 5% was designated as minor group. The gja8b mutant embryos with an opaque ratio is larger than 5% was designated as major group. (n ≥ 185 zebrafish for each group). Scale bars: 50 μm (D), 500 μm (E) and 10 μm (G). mean ± SEM, N.S., p > 0.05 PHENOTYPE:
|

Ablation of Gja8b induces severe defects in organelle degradation of lens fiber cells. (A-C) Immunohistochemistry results showed that lens primary fiber cell markers (A, labeled by Zl-1 and Mip staining), endoplasmic reticulum (B, labeled by Kdel staining), cytoskeleton (C, labeled by F-actin staining), and nuclei (C, labeled by DAPI staining) remained in lens second fiber cells in gja8b mutants at 72 hpf. (D) The quantitative analysis of the average number of lens fiber cell nuclei shown in different gja8b mutants groups (WT-like group, minor group and major group) (mean ± SEM, n ≥ 30 zebrafish for each group, ****p < 0.0001). (E and F) Immunohistochemistry results showed that cytoskeleton (labeled by F-actin staining), and nuclei (labeled by DAPI staining) remained in the center of lens in gja8b mutants at 4 dpf (E) and 5 dpf (F). Scale bars: 50 μm EXPRESSION / LABELING:
PHENOTYPE:
|

Autophagy is downregulated in lens fiber cells in gja8b mutant zebrafish. (A and B) Electron micrographs of lens fiber cells (LFC) and lens epithelial cells (LEC) in 36 hpf WT and gja8b mutants. Yellow arrowheads: autophagic vacuoles (AV). Scale bar: 100 nm. B is the number of AVs per area (40 μm2) in the lens of WT and gja8b mutants (n ≥ 60 cells from 6 lenses). (C and D) Immunoblot for endogenous Map1lc3b from WT and gja8b mutant zebrafish. (D) The quantitative analysis of the relative intensity of Map1lc3b-II compared to the Tubg1 (tubulin, gamma 1) control (n = 3 independent experiments). Mean ± SEM, N.S., p > 0.05, *p < 0.05, ****p < 0.0001 PHENOTYPE:
|

GJA8 promotes autophagy in HLE cells. (A and B) A shows immunoblot for LC3, and GJA8 from HLE cells in normal complete (NC) media and nutrient starvation media for 4 h (Sta4h). B shows the quantitative analysis of the relative intensity of GJA8 and LC3-II normalized to the TUBG control (n = 3 independent experiments). (C and D) Immunoblot for LC3 from HLE cells in NC media transfected with the different doses of GJA8-Flag. (D) Shows the quantitative analysis of the relative intensity of LC3-II compared to the TUBG control (n = 3 independent experiments). (E-H) E shows representative images for endogenous ATG16L1 and GJA8 in the NC group. (F) shows representative images for endogenous LC3 and GJA8 in NC and Sta4h groups. (G) is the quantitative analysis of the average number of endogenous LC3 puncta per cell. H is the quantitative analysis of the average number of colocalized GJA8 and LC3 puncta per cell (n = 3 wells, 3 independent experiments, > 50 cells per experiment). (I and J) I is representative images of LC3 and GJA8-GFP or GFP in HLE cells transfected with GJA8-GFP or GFP-vector. (J) The quantitative analysis of the average number of LC3 puncta per cell (n = 3 wells, 3 independent experiments, > 50 cells per experiment). Scale bars: 10 μm. Mean ± SEM, N.S., p > 0.05, *p < 0.05, **p < 0.01, ****p < 0.0001 |
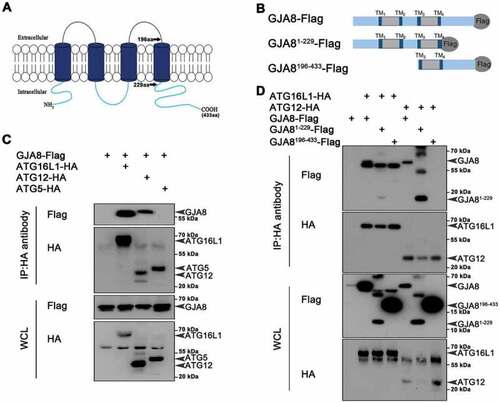
GJA8 interacts with Atg proteins. (A) Diagram of the GJA8 protein that contains 2 extracellular domains, 4 transmembrane domains and 3 intracellular domains. aa: amino acid. (B) Diagram of the different forms of GJA8 (GJA8-Flag, GJA81−229-Flag, GJA8196−433-Flag) tagged with Flag. (C) Immunoblot for immunoprecipitates from GJA8-Flag with Atg16L1-HA, ATG12-HA, or ATG9-HA in HEK293T cells. (D) Immunoblot for immunoprecipitates from ATG16L1 with GJA8-Flag, GJA81−229-Flag, GJA8196−433-Flag in HEK293T cells. WCL: whole cell lysis. WCL is used as a negative control for immunoprecipitates |

Rapamycin treatment promotes autophagy in gja8b mutant zebrafish lenses. (A-C) Electron micrographs of lens fiber cells (LFC) and lens epithelial cells (LEC) in 72 hpf WT, gja8b mutants, and gja8b mutants treated with 25 μM rapamycin. Yellow arrowheads show AV. (B) The number of AVs per area (40 μm2), and (C) is the average area of AVs in the lens epithelial and fiber cells in WT, gja8b mutants and gja8b mutants treated with 25 μM rapamycin (n ≥ 60 cells from 6 lenses). (D) Shows the concentration of endogenous Map1lc3b-I and Map1lc3b-II in the zebrafish eyes of WT, gja8b mutants, WT treated with 25 μM rapamycin and gja8b mutants treated with 25 μM rapamycin. Short exp and long exp: short exposure and long exposure. (E) shows the quantitative analysis of relative intensity of Map1lc3b-II normalized to the Tubg1 loading control (n = 3 independent experiments). (F) Shows the concentration of endogenous GJA8 and LC3 in NC or rapamycin-treated HLE cells. (G) Shows the quantitative analysis of relative intensity of GJA8 and LC3-II normalized to the TUBG loading control (n = 3 independent experiments). (H) Shows representative images for endogenous ATG16L1 and GJA8 in NC and rapamycin treated HLE cells. (I) Quantitative analysis of the average number of colocalized GJA8 and ATG16L1 puncta per cell. (n = 3 wells, 3 independent experiments, > 50 cells per experiment). Scale bar: 100 nm (A) and 10 μm (H). Mean ± SEM, N.S., p > 0.05, *p < 0.05, **p < 0.01, ***p < 0.001, ****p < 0.0001 PHENOTYPE:
|
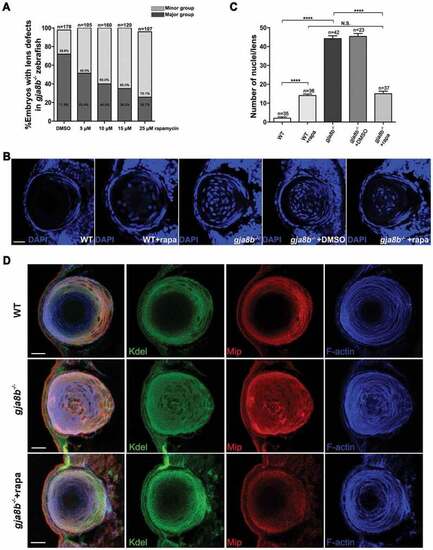
Rapamycin treatment relieves cataract/lens defects in gja8b mutant zebrafish. (A) Statistical analysis of the severity of lens defects in 72 hpf gja8b mutants treated with rapamycin. Horizontal axis labeling shows the final concentration of rapamycin (n > 100 zebrafish for each group). (B) Shows representative images of the nuclei of lens fiber cells in WT, gja8b mutants, gja8b mutants treated with DMSO, and WT and gja8b mutants treated with 25 μM rapamycin at 72 hpf. (C) Shows the quantitative analysis of the average number of lens fiber cell nuclei shown in B (n > 20 zebrafish for each group). (D) Representative images to show the distribution of Kdel, Mip and F-actin in the lens of WT, gja8b mutants, and gja8b mutants treated with 25 μM rapamycin. Scale bars: 50 μm. Mean ± SEM, N.S., p > 0.05, ****p < 0.0001 EXPRESSION / LABELING:
PHENOTYPE:
|
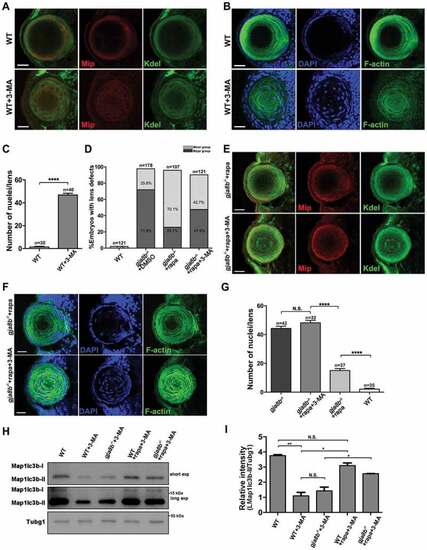
3-MA treatment blocks the rescue effects of rapamycin in gja8b mutant zebrafish lenses. (A) Shows representative images of the distribution of Kdel and Mip, and (B) shows representative images of nuclei and F-actin in the lens of WT and WT zebrafish treated with 4 mM 3-MA at 72 hpf. (C) Average number of lens fiber cell nuclei per lens (n > 30 zebrafish for each group). (D) Statistical analysis of the severity of lens defects in 72 hpf WT, gja8b mutants, gja8b mutants treated with rapamycin, and gja8b mutants treated with 25 μM rapamycin and 4 mM 3-MA (n > 120 zebrafish for each group). (E) Shows representative images of the distribution of Kdel and Mip, and (F) shows representative images of nuclei and F-actin in the lens of gja8b mutants treated with 25 μM rapamycin and gja8b mutants treated with 25 μM rapamycin plus 4 mM 3-MA at 72 hpf. (G) Average number of lens fiber cell nuclei per lens (n > 30 zebrafish for each group). (H) Shows the concentration of endogenous Map1lc3b-I and Map1lc3b-II in WT, WT treated with 4 mM 3-MA, gja8b mutants treated with 4 mM 3-MA, WT treated with 25 μM rapamycin and 4 mM 3-MA, and gja8b mutants treated with 25 μM rapamycin and 4 mM 3-MA. Short exp and long exp: short exposure and long exposure. (I) Shows the quantitative analysis of relative intensity of Map1lc3b-II normalized to the Tubg1 control (n = 3 independent experiments). Scale bars: 50 μm. Mean ± SEM, *p < 0.05, **p < 0.01, ****p < 0.0001 EXPRESSION / LABELING:
PHENOTYPE:
|