
Fig. 4
- ID
- ZDB-IMAGE-221221-34
- Publication
- Ping et al., 2021 - Rapamycin relieves the cataract caused by ablation of Gja8b through stimulating autophagy in zebrafish
- All Figures
- Figures for Ping et al., 2021
|
Fig. 4
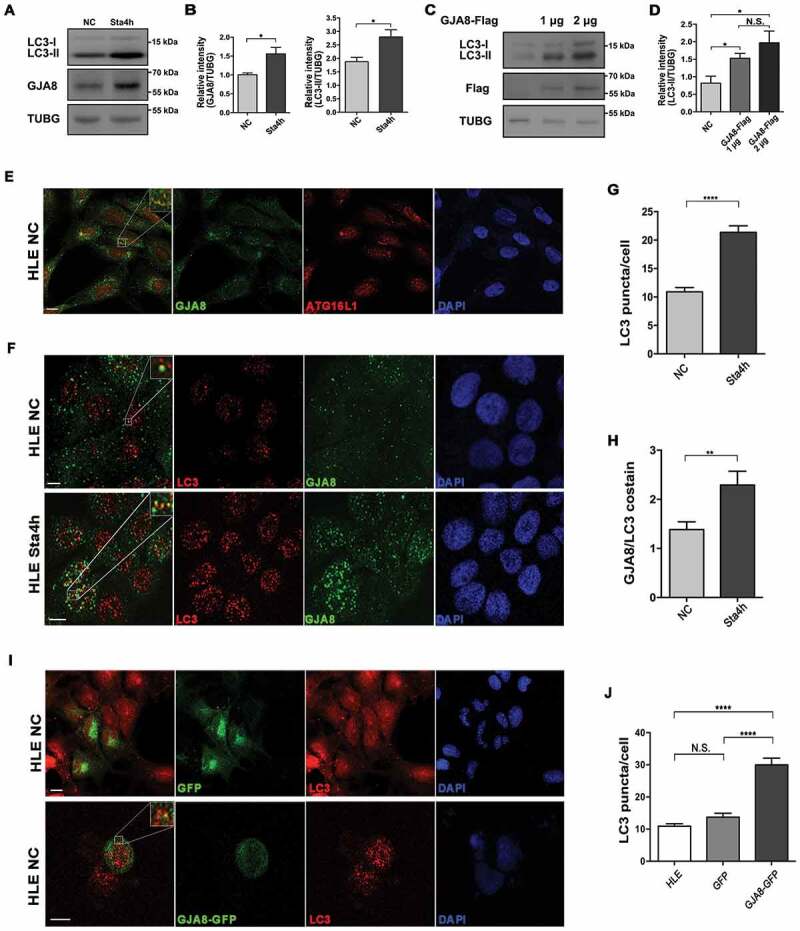
GJA8 promotes autophagy in HLE cells. (A and B) A shows immunoblot for LC3, and GJA8 from HLE cells in normal complete (NC) media and nutrient starvation media for 4 h (Sta4h). B shows the quantitative analysis of the relative intensity of GJA8 and LC3-II normalized to the TUBG control (n = 3 independent experiments). (C and D) Immunoblot for LC3 from HLE cells in NC media transfected with the different doses of GJA8-Flag. (D) Shows the quantitative analysis of the relative intensity of LC3-II compared to the TUBG control (n = 3 independent experiments). (E-H) E shows representative images for endogenous ATG16L1 and GJA8 in the NC group. (F) shows representative images for endogenous LC3 and GJA8 in NC and Sta4h groups. (G) is the quantitative analysis of the average number of endogenous LC3 puncta per cell. H is the quantitative analysis of the average number of colocalized GJA8 and LC3 puncta per cell (n = 3 wells, 3 independent experiments, > 50 cells per experiment). (I and J) I is representative images of LC3 and GJA8-GFP or GFP in HLE cells transfected with GJA8-GFP or GFP-vector. (J) The quantitative analysis of the average number of LC3 puncta per cell (n = 3 wells, 3 independent experiments, > 50 cells per experiment). Scale bars: 10 μm. Mean ± SEM, N.S., p > 0.05, *p < 0.05, **p < 0.01, ****p < 0.0001