
Fig. 8
- ID
- ZDB-IMAGE-221221-38
- Antibodies
- Publication
- Ping et al., 2021 - Rapamycin relieves the cataract caused by ablation of Gja8b through stimulating autophagy in zebrafish
- All Figures
- Figures for Ping et al., 2021
|
Fig. 8
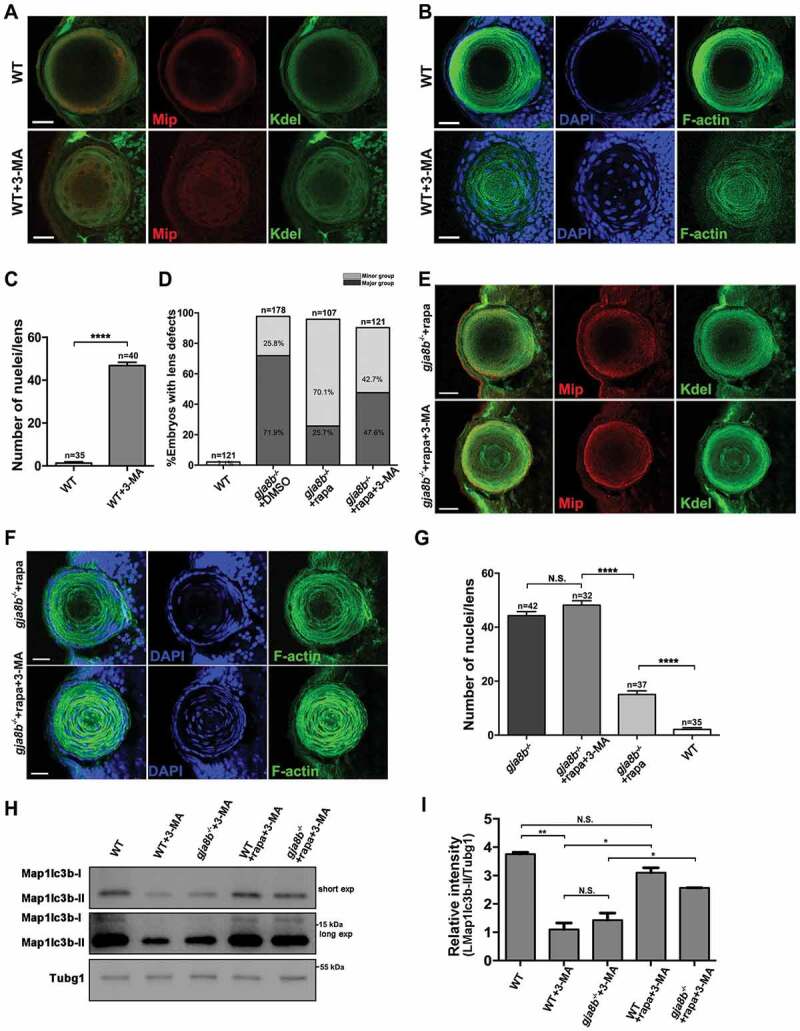
3-MA treatment blocks the rescue effects of rapamycin in gja8b mutant zebrafish lenses. (A) Shows representative images of the distribution of Kdel and Mip, and (B) shows representative images of nuclei and F-actin in the lens of WT and WT zebrafish treated with 4 mM 3-MA at 72 hpf. (C) Average number of lens fiber cell nuclei per lens (n > 30 zebrafish for each group). (D) Statistical analysis of the severity of lens defects in 72 hpf WT, gja8b mutants, gja8b mutants treated with rapamycin, and gja8b mutants treated with 25 μM rapamycin and 4 mM 3-MA (n > 120 zebrafish for each group). (E) Shows representative images of the distribution of Kdel and Mip, and (F) shows representative images of nuclei and F-actin in the lens of gja8b mutants treated with 25 μM rapamycin and gja8b mutants treated with 25 μM rapamycin plus 4 mM 3-MA at 72 hpf. (G) Average number of lens fiber cell nuclei per lens (n > 30 zebrafish for each group). (H) Shows the concentration of endogenous Map1lc3b-I and Map1lc3b-II in WT, WT treated with 4 mM 3-MA, gja8b mutants treated with 4 mM 3-MA, WT treated with 25 μM rapamycin and 4 mM 3-MA, and gja8b mutants treated with 25 μM rapamycin and 4 mM 3-MA. Short exp and long exp: short exposure and long exposure. (I) Shows the quantitative analysis of relative intensity of Map1lc3b-II normalized to the Tubg1 control (n = 3 independent experiments). Scale bars: 50 μm. Mean ± SEM, *p < 0.05, **p < 0.01, ****p < 0.0001