
Fig. 1
- ID
- ZDB-FIG-221221-35
- Publication
- Ping et al., 2021 - Rapamycin relieves the cataract caused by ablation of Gja8b through stimulating autophagy in zebrafish
- Other Figures
- All Figure Page
- Back to All Figure Page
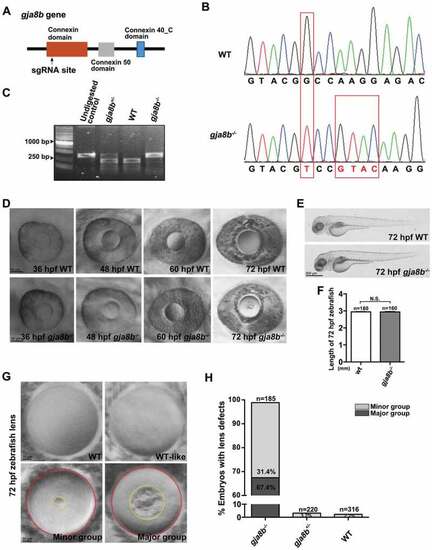
Ablation of Gja8b induces cataracts in zebrafish. (A) Schematic illustration of the position (amino acid 136) of the gja8b gene edited by sgRNA. (B) Sanger sequencing results showed that 1 base pair (bp) was substituted and 4 bp were inserted in gja8b mutant zebrafish, causing the loss of the recognition site for the restriction enzyme StyI. The genome editing led to a truncated Gja8b proteins (amino acid 1–136 followed by 22 mistranslated amino acids). (C) The gja8b mutant zebrafish were genotyped with PCR, which was followed by StyI digestion. The undigested WT PCR products was loaded as a control. The PCR products of WT fish (386 bp) could be digested with StyI to generate two fragments (236 bp and 150 bp). The PCR products of homozygous gja8b mutants could not be digested with StyI. (D) Ablation of Gja8b induced cataracts in zebrafish at 72 hpf. (E and F) Ablation of Gja8b did not affect the overall development of zebrafish. (E) Shows the WT and gja8b mutant larvae at 72 hpf. (F) Statistical analysis of length of larvae at 72 hpf (n ≥ 160 zebrafish for each group). (G and H) The cataract phenotypes displayed various severities in individual gja8b mutant zebrafish at 72 hpf. (H) Shows the statistical analysis of (G). In total, 1.2% of gja8b mutants did not display defects, 31.4% displayed light defects (Minor group), and 67.4% displayed severe defects in lenses (Major group). Yellow circles mark the opacity area in gja8b mutant lens, red circles mark the whole lens. The gja8b mutant embryos with an opaque ratio between the opaque area and the whole lens area is smaller than 5% was designated as minor group. The gja8b mutant embryos with an opaque ratio is larger than 5% was designated as major group. (n ≥ 185 zebrafish for each group). Scale bars: 50 μm (D), 500 μm (E) and 10 μm (G). mean ± SEM, N.S., p > 0.05 |
| Fish: | |
|---|---|
| Observed In: | |
| Stage: | Protruding-mouth |