
- Title
-
Pseudomonas aeruginosa OprF plays a role in resistance to macrophage clearance during acute infection
- Authors
- Moussouni, M., Berry, L., Sipka, T., Nguyen-Chi, M., Blanc-Potard, A.B.
- Source
- Full text @ Sci. Rep.
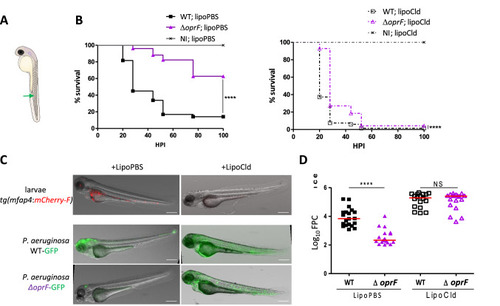
The |
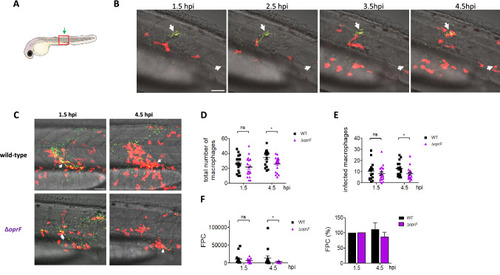
Real-time visualization and quantification of phagocytosis of |
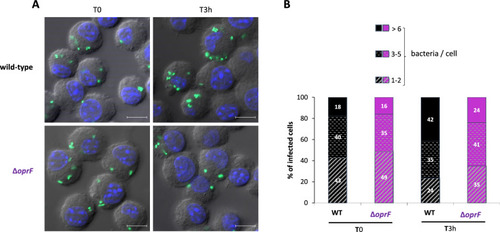
Visualization and quantification of intracellular |
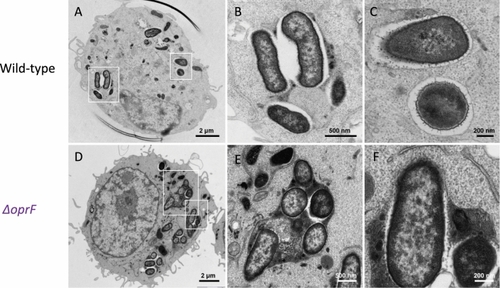
Transmission electron micrographs (TEM) of |
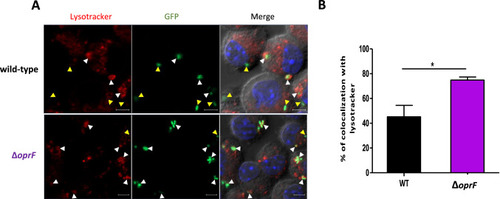
Colocalization of |
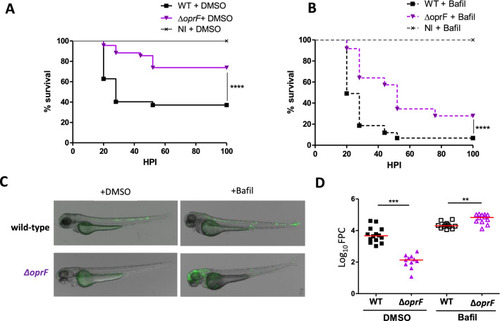
Effect of bafilomycin on the virulence of wild-type and Δ |