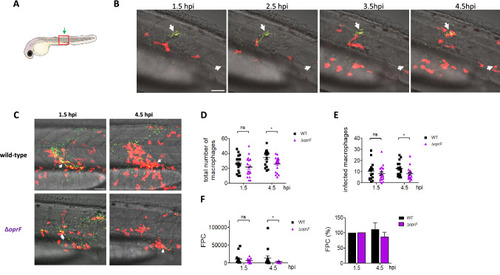
Real-time visualization and quantification of phagocytosis of P. aeruginosa after local injection into muscle of wild-type and ΔoprF strains. (A) Illustration of zebrafish larva with the muscle (in red) injection site (green arrow). (B) Confocal time-lapse images of tg(mfap4:mCherry-F) larva (red macrophages) infected with ΔoprF P. aeruginosa (green) by injection in the muscle. The same area was imaged every hour from 1.5 hpi. White arrows depict GFP-expressing P. aeruginosa that will be taken up by macrophages, which are recruited at the bacterial location. Maximum intensity projection of 96 sections every 1 µm, scale bar 50 µm. (C) Confocal time-lapse images of tg(mfap4:mCherry-F) larvae (red macrophages) infected with wild-type or ΔoprF P. aeruginosa (green) by injection in the muscle. The left panel is at 1.5 hpi and the right panel a 4.5 hpi. White arrows depict GFP-expressing P. aeruginosa phagocytosed by macrophages. Maximum intensity projection of 96 sections every 1 µm, scale bar 50 µm. (D) Quantification of recruited macrophages at 1.5 and 4.5 hpi, from three independent experiments. Each symbol represents individual embryo (16 to 18 embryos for each strain) and horizontal lines indicate the mean values ± SEM. Statistical significance was determined by two-tailed t test, ns—not significant, *p < 0.05. (E) Quantification of infected macrophages, from three independent experiments. Mean ± SEM, two-tailed Mann–Whitney’s test, ns—not significant, *p < 0.05. (F) Quantification of bacterial loads (fluorescence pixel counts) from three independent experiments, presented as total value (left) or percentage of the FPC value at first time point (1.5 hpi), counted for each embryo. Mean ± SEM, two-tailed Mann–Whitney’s test, ns—not significant, *p < 0.05.
|
