IMAGE

Figure 3

ID
ZDB-IMAGE-210117-21
Source
Figures for Moussouni et al., 2021
Image
Figure Caption

Figure 3

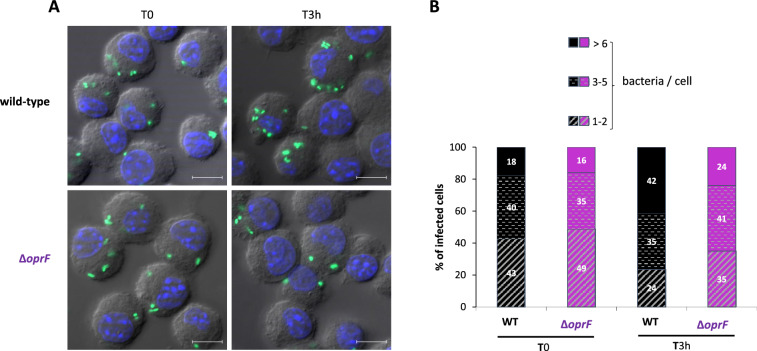
Visualization and quantification of intracellular P. aeruginosa within macrophages. GFP-expressing PAO1 WT and ∆oprF strains were used for infecting J774 macrophages. Cells were fixed after phagocytosis and 20 min (T0) or 2.5 h (T3h) treatment with gentamycin and imaged with fluorescent microscope. DAPI was used to stain the nucleus. (A) Visualization of intracellular bacteria. The merged image shows Differential Interference Contrast (DIC), nucleus staining (blue) and bacteria expressing GFP (green). The scale bars depict 10 µm. (B) Count of the number of bacteria in infected macrophages from images obtained. The numbers of bacteria per cell were classified in three groups (1–2, 3–5 and > 6 bacteria per cell) and percentage of each class is shown. Count is done from 100 cells per condition and results are expressed as means from three independent experiments.

Acknowledgments
This image is the copyrighted work of the attributed author or publisher, and ZFIN has permission only to display this image to its users. Additional permissions should be obtained from the applicable author or publisher of the image. Full text @ Sci. Rep.