FIGURE SUMMARY
Title

In vivo Validation of Bimolecular Fluorescence Complementation (BiFC) to Investigate Aggregate Formation in Amyotrophic Lateral Sclerosis (ALS)

Authors
Don, E.K., Maschirow, A., Radford, R.A.W., Scherer, N.M., Vidal-Itriago, A., Hogan, A., Maurel, C., Formella, I., Stoddart, J.J., Hall, T.E., Lee, A., Shi, B., Cole, N.J., Laird, A.S., Badrock, A.P., Chung, R.S., Morsch, M.
Source
Full text @ Mol. Neurobiol.

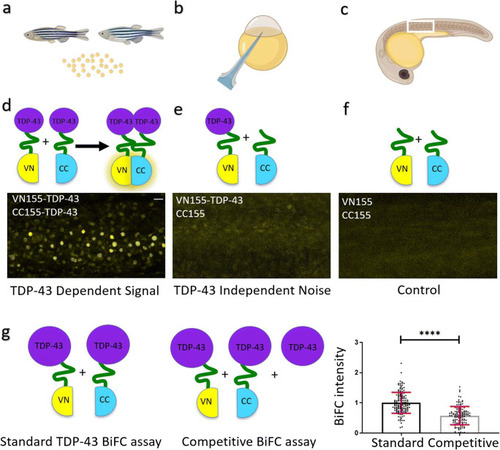
TDP-43 aggregation in zebrafish is specific. BiFC assay to determine TDP-43 aggregation. ac Graphical illustration of the workflow. Male and female zebrafish are set up to collect the fertilized eggs (a). Eggs at the 1–2-cell stage are microinjected (b) with a combination of BiFC mRNA as illustrated below. Embryos are raised and BiFC complementation is visualized using a microscope (c). df Top schematics illustrate the different injection combinations. d TDP-43-aggregation and respective fluorescent signal in zebrafish somites at 24 hpf. e TDP-43-independent signal (noise). f Control (background) fluorescence at 24 hpf. Scale bar represents 20 μm. g Comparison of BiFC intensity after standard and competitive TDP-43 BiFC injections. The bar diagram shows the quantitative comparison of the normalized BiFC intensity in this fluorescence complementation assay. Dot points represent individual fish and data were pooled from 4 independent experiments. ****P < 0.0001

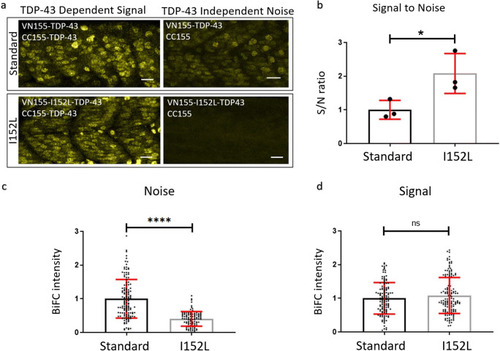
Optimized mVenus fragment (VN155-I152L) increases the signal-to-noise ratio of TDP-43 complementation. a Representative microscope images demonstrating the fluorescence reconstitution in muscle tissue at 24 hpf using VN155-TDP-43 versus VN155-I152L-TDP-43 constructs. Scale bars represent 20 μm. b Quantitative comparison of signal-to-noise ratio using standard VN155 versus VN155-I152L fragments. Data was obtained using an unbiased plate reader. Data pooled and averaged from three independent replicates. c, d The background fluorescence (noise) was significantly reduced with the I152L mutation (c), while the maximum fluorescence intensity did not change (d). Data in c, d was obtained using an unbiased plate reader. Data pooled from three independent replicates. *P < 0.05; ****P < 0.0001; nsP > 0.05

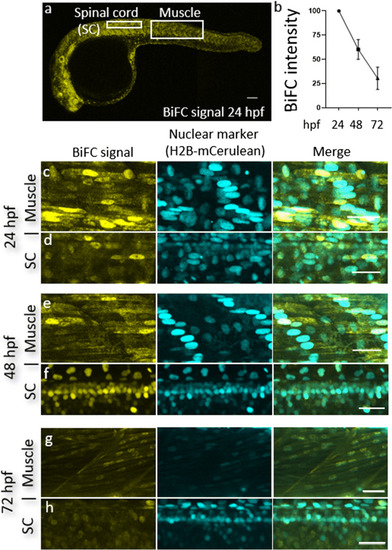
TDP-43 BiFC can be detected in muscle cells and motor neurons and is predominantly nuclear. a A representative image of a 24 hpf embryo injected with our TDP-43 BiFC constructs. Scale bar, 200 μm. b Fluorescent intensity as a percentage of signal at 24 hpf. c, d Representative pictures of the human wild-type TDP-43 BiFC signal at 24 hpf in muscle cells (c) and spinal cord motor neurons (d). e, f Representative pictures of the human wild-type TDP-43 BiFC signal at 48 hpf in muscle cells (e) and spinal cord motor neurons (f). g, h Representative pictures of the human wild-type TDP-43 BiFC signal at 72 hpf in muscle cells (g) and spinal cord motor neurons (h). Scale bar, 30 μm

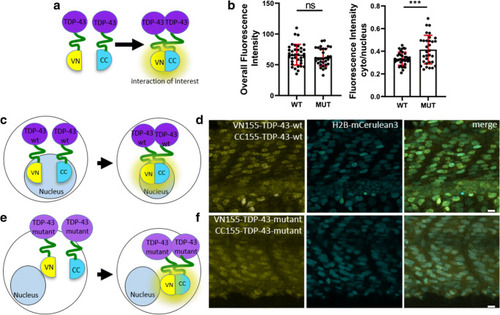
Mutant TDP-43 BiFC is mislocalized to the cytoplasm. a, c, e Schemes of fluorophores used in this TDP-43 BiFC assays. b Quantification of fluorescence intensity demonstrates that mutant TDP-43 BiFC is shifted to the cytoplasm with no change to overall fluorescence intensity. df Representative fluorescence images of the wild-type and mutant TDP-43 BiFC signal at 36 hpf in the somites over the yolk extension. Scale bars, 10 μm

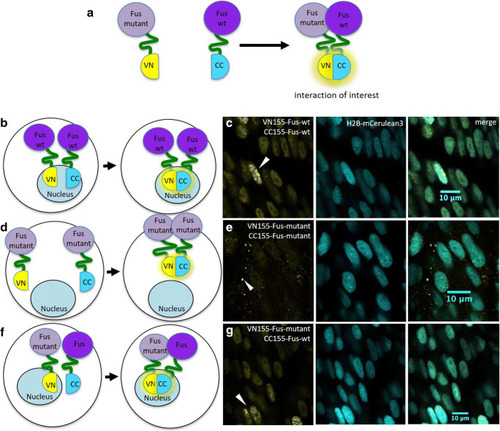
Wild-type and cytoplasmic localized mutant Fus BiFC assay in zebrafish. a, b, d, f Schemes of fluorophores used in this Fus BiFC assays. c Representative fluorescence images of the zebrafish wild-type Fus BiFC signal at 28 hpf in the somites over the yolk extension. e Mutant Fus BiFC signal is observed as discrete puncta in the cytoplasm. g The combination of mutant and wild-type Fus constructs reconstitutes primarily nuclear. Scale bars, 10 μm

Acknowledgments
This image is the copyrighted work of the attributed author or publisher, and ZFIN has permission only to display this image to its users. Additional permissions should be obtained from the applicable author or publisher of the image. Full text @ Mol. Neurobiol.