
- Title
-
A novel nitroalkene vitamin E analogue inhibits the NLRP3 inflammasome and protects against inflammation and glucose intolerance triggered by obesity
- Authors
- Dapueto, R., Rodriguez-Duarte, J., Galliussi, G., Kamaid, A., Bresque, M., Batthyány, C., López, G.V., Escande, C.
- Source
- Full text @ Redox Biol.
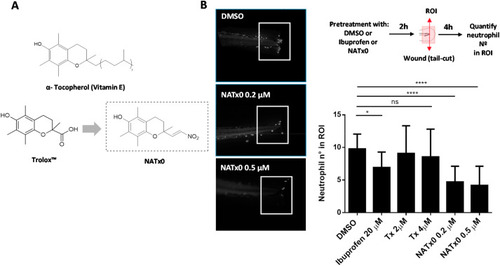
Fig. 1. NATx0 inhibits acute inflammatory response in zebrafish larvae. A, α- Tocopherol Vitamin E, its hydrosoluble form (Trolox™) and Trolox-derived nitroalkene NATx0 chemical structures are shown. B, NATx0 inhibits neutrophil recruitment in an acute inflammatory assay in zebrafish larvae. Briefly, 3 dpf zebrafish neutrophil-specific larvae Tg (mpx:GFP) were pretreated with NATx0, Trolox or Ibuprofen for 2 h and wounded in tail fins by transection with a scapel. After, larvae were incubated again in the presence of the compounds during 4 h and then recruited neutrophils were imaged and quantified. Experimental diagram and representative pictures obtained corresponding to DMSO, NATx0 0.2 μM and NATx0 0.5 μM are shown. Graph represent the quantification of the neutrophils recruited to wounded fins inside a defined ROI. Bar graphs shown are the mean ± S.D. (error bars) of at least 17 larvae in each condition. Data represents two independent experiments. Statistical analysis: One-way ANOVA with Bonferroni's multiple comparison test, * = 0.0487; DMSO vs Tx 2 μM ns = 0.992; DMSO vs Tx 4 μM ns = 0.844; **** <0.0001; **** <0.0001. PHENOTYPE:
|
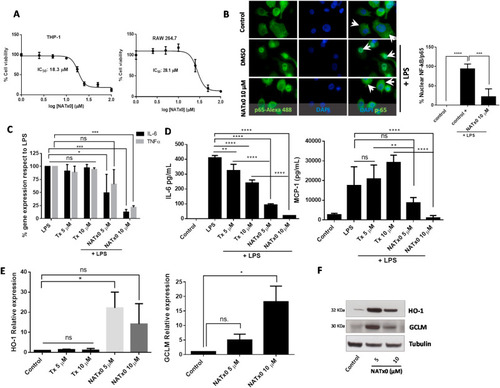
Fig. 2. NATx0 inhibits NF-kB-dependent signaling and activates anti-oxidant responses through Nrf2/keap1 system. A, Differentiated THP-1 and Raw 264.7 macrophages were incubated with increasing concentrations of NATx0 (0, 2.5, 5.0, 10, 25, 50 and 100 μM) for 24 h. Then a standard MTT assay was performed. DMSO control was added resulting in 100% viability. IC50 refers to NATx0 dose at which cell viability is reduced by half. B, Differentiated THP-1 cells were incubated with NATx0 for 2 h (10 μM) or vehicle and activated with 1 μg/mL LPS for 30 min and then fixed with 4% PFA. Rabbit anti-p65 antibody and Alexa Fluor 488-conjugated secondary antibody were used for labeling NF-kB-p65 subunit (green). Nucleus were stained using DAPI (blue). Arrowheads point nuclear or cytoplasmic localization of p65/RelA subunit. Graph shows the percentage of nuclear signal quantification after stimulation with PBS (control) or LPS after pre-incubation with DMSO (control +) or NATx0 10 μM. One-way ANOVA with Bonferroni's multiple comparison test: **** <0.0001; *** = 0.0002. C, Differentiated THP-1 cells were incubated with 5 and 10 μM of NATx0 or Tx for 2 h and treated with LPS (1 μg/mL) for 3 h. IL-6 and TNFα gene expression was studied by qPCR. One-way ANOVA with Bonferroni's multiple comparison test, IL-6: LPS vs Tx 5 μM ns = 0.9796; LPS vs Tx 10 μM ns >0.999; LPS vs NATx0 5 μM * = 0.0186; LPS vs NATx0 10 μM *** = 0.0002. TNFα: LPS vs Tx 5 μM ns = 0.9454; LPS vs Tx 10 μM ns = 0.998; LPS vs NATx0 5 μM ns = 0.1522; LPS vs NATx0 10 μM *** = 0.0005. D, Raw 264.7 macrophages were incubated with NATx0 or Tx (5 and 10 μM) or vehicle for 2 h and then treated with LPS (1 μg/mL) for 16 h. IL-6 and MCP-1 cytokines released to supernatant were analyzed by ELISA. Control refers to untreated cells. One-way ANOVA with Bonferroni's multiple comparison test, IL-6: LPS vs Tx 5 μM ** = 0.0032; LPS vs Tx 10 μM **** <0.0001; LPS vs NATx0 5 μM **** <0.0001; LPS vs NATx0 10 μM **** <0.0001. MCP-1: LPS vs Tx 5 μM ns >0.999; LPS vs Tx 10 μM ** = 0.0076; LPS vs NATx0 5 μM ns = 0.1002; LPS vs NATx0 10 μM **** <0.0001; Tx 5 μM vs NATx0 5 μM ** = 0.0052; Tx 10 μM vs NATx0 10 μM **** <0.0001. E, HO-1 and GCLM gene expression after 5 h incubation with NATx0 and Tx (5 and 10 μM) was studied by qPCR. One-way ANOVA with Bonferroni's multiple comparison test, HO-1: Control vs Tx 5 and 10 μM ns >0.999; Control vs NATx0 5 μM * = 0.010; Control vs NATx0 10 μM ns = 0.1979; Tx 5 μM vs NATx0 5 μM <0.0001; Tx 10 μM vs NATx0 10 μM <0.0001. F, HO-1 and GCLM protein expression by western blot after 5 h incubation with NATx0 5 and 10 μM.Data are representative of two or three independent experiments. Bar graphs shown are the mean ± S.D. (error bars). . (For interpretation of the references to colour in this figure legend, the reader is referred to the Web version of this article.) |
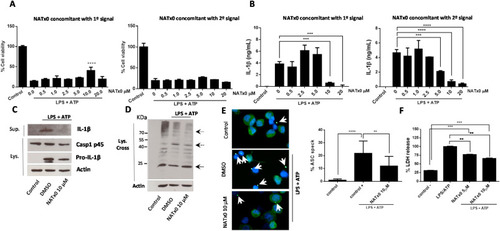
Fig. 3. NATx0 modulates NLRP3 inflammasome in differentiated THP-1 cells. A, % Cell viability calculated by MTT after NLRP3 activation, when NATx0 was applied in concomitant with LPS (“first signal protocol”) for 3 h and after with ATP for 45 min; or when NATx0 was applied together with ATP for 45 min (“second signal protocol”) after 3 h LPS stimulus. One-way ANOVA with Bonferroni's multiple comparison test: **** <0.0001. B, IL-1β formation is inhibited by NATx0 in a dose-dependent manner when it is applied together with first signal or second signal. One-way ANOVA with Bonferroni's multiple comparison test: *** = 0.001 0 vs. 10 μM NATx0; *** = 0.0002 0 vs. 20 μM NATx0 (left graph); *** = 0.0024; **** <0.0001 (right graph). C, Western blot analysis of proIL-1β, pro-caspase 1 (p45) and active IL-1β after inflammasome activation in the presence of 10 μM NATx0 or DMSO (vehicle) when applied in concomitant with “second signal”. D, Western blot analysis of ASC oligomers formation in crosslinked cells after inflammasome activation in the presence of 10 μM NATx0 or DMSO (vehicle) when applied in concomitant with “second signal”. ASC monomers were detected at 24 kDa, dimers at 48 kDa and oligomers over 65 kDa (dotted arrows). E, ASC “speck” detection by fluorescence microscopy after inflammasome activation in the presence of 10 μM NATx0 or DMSO when applied in concomitant with “second signal”. Cells were fixed, permeabilized and stained for ASC (green). Specks are denoted in white arrows. Percentage of ASC speck formation over ASC- positive cells is shown. One-way ANOVA with Bonferroni's multiple comparison test: **** <0.0001; ** = 0.0087. F, LDH (lactate dehydrogenase) release after inflammasome activation in the presence of 5 and 10 μM NATx0 or DMSO when applied in concomitant with “second signal”. One-way ANOVA with Bonferroni's multiple comparison test: *** = 0.0002; ** = 0.0098. Control in all cases refers to untreated cells. |
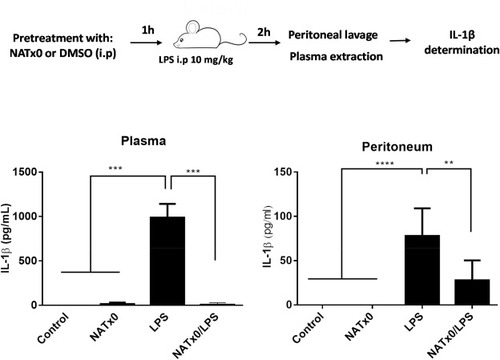
Fig. 4. NATx0 inhibits acute NLRP3 activation and IL-1β production in vivo. C57BL/6 mice were injected intraperitoneally (i.p) with 20 mg/kg NATx0 or vehicle (DMSO) 1 h before i.p. injection of 10 mg/kg LPS Escherichia coli or PBS. After 2 h mice were killed and levels of IL-1β in serum and peritoneum was measured by ELISA. One-way ANOVA with Bonferroni's multiple comparison test: *** <0.0001; **** <0.0001; ** = 0.0004 (n = 7 per group). |
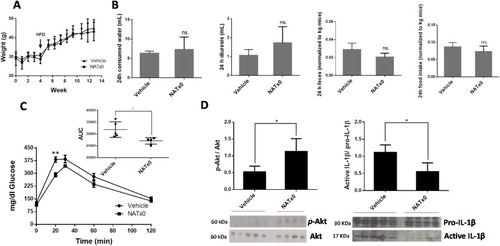
Fig. 5. NATx0 reduces glucose intolerance in a mouse model of diet-induced obesity. C57BL/6 mice were treated orally with NATx0 (150 mg/kg) or vehicle for 4 weeks under normal rodent chow diet. After, animals were fed with high fat diet (HFD) and treated orally with NATx0 (150 mg/kg) or vehicle for another 11 weeks. A, Graph shows animal weight evolution during the course of the experiment. At week 4, mice started to ate HFD. B, At week 12, consumed water, diuresis, feces and food intake parameters were measured in metabolic cages within 24 h in NATx0 treated or vehicle treated mice. Two-tailed unpaired t-test: ns > 0.25. C, Glucose tolerance test (GTT) was performed by i.p injection of 1.5 g/kg body weight of glucose solution to fasted mice and plasma glucose was measured in blood before and after 15, 30, 60, and 120 min of the injection. Two-tailed unpaired t-test: ** = 0.0031. Inset shows calculated area under the curve (AUC) for NATx0 or vehicle treated mice glucose response. Two-tailed unpaired t-test: * = 0.0319. D, At the end of the experiment, mice were injected with 0.5 U/kg body weight of insulin and sacrificed to obtain muscle. Western blot analysis was performed to analyze p-Akt, Akt and IL-1β protein expression in muscle. Two-tailed unpaired t-test: vehicle vs. NATx0 * = 0.0147 for p-Akt/Akt and * = 0.0131 for pro-IL-1β/IL-1β. |