
Fig. 2
- ID
- ZDB-FIG-210303-76
- Publication
- Dapueto et al., 2020 - A novel nitroalkene vitamin E analogue inhibits the NLRP3 inflammasome and protects against inflammation and glucose intolerance triggered by obesity
- Other Figures
- All Figure Page
- Back to All Figure Page
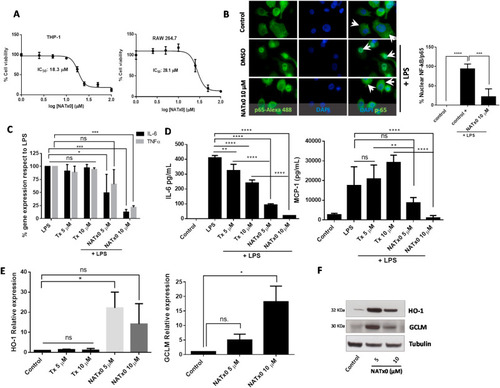
Fig. 2. NATx0 inhibits NF-kB-dependent signaling and activates anti-oxidant responses through Nrf2/keap1 system. A, Differentiated THP-1 and Raw 264.7 macrophages were incubated with increasing concentrations of NATx0 (0, 2.5, 5.0, 10, 25, 50 and 100 μM) for 24 h. Then a standard MTT assay was performed. DMSO control was added resulting in 100% viability. IC50 refers to NATx0 dose at which cell viability is reduced by half. B, Differentiated THP-1 cells were incubated with NATx0 for 2 h (10 μM) or vehicle and activated with 1 μg/mL LPS for 30 min and then fixed with 4% PFA. Rabbit anti-p65 antibody and Alexa Fluor 488-conjugated secondary antibody were used for labeling NF-kB-p65 subunit (green). Nucleus were stained using DAPI (blue). Arrowheads point nuclear or cytoplasmic localization of p65/RelA subunit. Graph shows the percentage of nuclear signal quantification after stimulation with PBS (control) or LPS after pre-incubation with DMSO (control +) or NATx0 10 μM. One-way ANOVA with Bonferroni's multiple comparison test: **** <0.0001; *** = 0.0002. C, Differentiated THP-1 cells were incubated with 5 and 10 μM of NATx0 or Tx for 2 h and treated with LPS (1 μg/mL) for 3 h. IL-6 and TNFα gene expression was studied by qPCR. One-way ANOVA with Bonferroni's multiple comparison test, IL-6: LPS vs Tx 5 μM ns = 0.9796; LPS vs Tx 10 μM ns >0.999; LPS vs NATx0 5 μM * = 0.0186; LPS vs NATx0 10 μM *** = 0.0002. TNFα: LPS vs Tx 5 μM ns = 0.9454; LPS vs Tx 10 μM ns = 0.998; LPS vs NATx0 5 μM ns = 0.1522; LPS vs NATx0 10 μM *** = 0.0005. D, Raw 264.7 macrophages were incubated with NATx0 or Tx (5 and 10 μM) or vehicle for 2 h and then treated with LPS (1 μg/mL) for 16 h. IL-6 and MCP-1 cytokines released to supernatant were analyzed by ELISA. Control refers to untreated cells. One-way ANOVA with Bonferroni's multiple comparison test, IL-6: LPS vs Tx 5 μM ** = 0.0032; LPS vs Tx 10 μM **** <0.0001; LPS vs NATx0 5 μM **** <0.0001; LPS vs NATx0 10 μM **** <0.0001. MCP-1: LPS vs Tx 5 μM ns >0.999; LPS vs Tx 10 μM ** = 0.0076; LPS vs NATx0 5 μM ns = 0.1002; LPS vs NATx0 10 μM **** <0.0001; Tx 5 μM vs NATx0 5 μM ** = 0.0052; Tx 10 μM vs NATx0 10 μM **** <0.0001. E, HO-1 and GCLM gene expression after 5 h incubation with NATx0 and Tx (5 and 10 μM) was studied by qPCR. One-way ANOVA with Bonferroni's multiple comparison test, HO-1: Control vs Tx 5 and 10 μM ns >0.999; Control vs NATx0 5 μM * = 0.010; Control vs NATx0 10 μM ns = 0.1979; Tx 5 μM vs NATx0 5 μM <0.0001; Tx 10 μM vs NATx0 10 μM <0.0001. F, HO-1 and GCLM protein expression by western blot after 5 h incubation with NATx0 5 and 10 μM.Data are representative of two or three independent experiments. Bar graphs shown are the mean ± S.D. (error bars). . (For interpretation of the references to colour in this figure legend, the reader is referred to the Web version of this article.) |