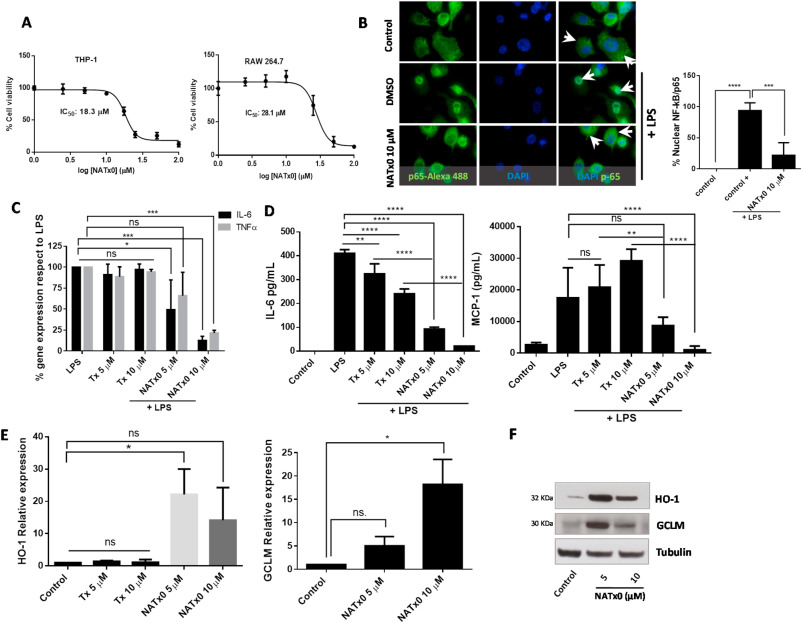
Fig. 2 Fig. 2. NATx0 inhibits NF-kB-dependent signaling and activates anti-oxidant responses through Nrf2/keap1 system. A, Differentiated THP-1 and Raw 264.7 macrophages were incubated with increasing concentrations of NATx0 (0, 2.5, 5.0, 10, 25, 50 and 100 μM) for 24 h. Then a standard MTT assay was performed. DMSO control was added resulting in 100% viability. IC50 refers to NATx0 dose at which cell viability is reduced by half. B, Differentiated THP-1 cells were incubated with NATx0 for 2 h (10 μM) or vehicle and activated with 1 μg/mL LPS for 30 min and then fixed with 4% PFA. Rabbit anti-p65 antibody and Alexa Fluor 488-conjugated secondary antibody were used for labeling NF-kB-p65 subunit (green). Nucleus were stained using DAPI (blue). Arrowheads point nuclear or cytoplasmic localization of p65/RelA subunit. Graph shows the percentage of nuclear signal quantification after stimulation with PBS (control) or LPS after pre-incubation with DMSO (control +) or NATx0 10 μM. One-way ANOVA with Bonferroni's multiple comparison test: **** <0.0001; *** = 0.0002. C, Differentiated THP-1 cells were incubated with 5 and 10 μM of NATx0 or Tx for 2 h and treated with LPS (1 μg/mL) for 3 h. IL-6 and TNFα gene expression was studied by qPCR. One-way ANOVA with Bonferroni's multiple comparison test, IL-6: LPS vs Tx 5 μM ns = 0.9796; LPS vs Tx 10 μM ns >0.999; LPS vs NATx0 5 μM * = 0.0186; LPS vs NATx0 10 μM *** = 0.0002. TNFα: LPS vs Tx 5 μM ns = 0.9454; LPS vs Tx 10 μM ns = 0.998; LPS vs NATx0 5 μM ns = 0.1522; LPS vs NATx0 10 μM *** = 0.0005. D, Raw 264.7 macrophages were incubated with NATx0 or Tx (5 and 10 μM) or vehicle for 2 h and then treated with LPS (1 μg/mL) for 16 h. IL-6 and MCP-1 cytokines released to supernatant were analyzed by ELISA. Control refers to untreated cells. One-way ANOVA with Bonferroni's multiple comparison test, IL-6: LPS vs Tx 5 μM ** = 0.0032; LPS vs Tx 10 μM **** <0.0001; LPS vs NATx0 5 μM **** <0.0001; LPS vs NATx0 10 μM **** <0.0001. MCP-1: LPS vs Tx 5 μM ns >0.999; LPS vs Tx 10 μM ** = 0.0076; LPS vs NATx0 5 μM ns = 0.1002; LPS vs NATx0 10 μM **** <0.0001; Tx 5 μM vs NATx0 5 μM ** = 0.0052; Tx 10 μM vs NATx0 10 μM **** <0.0001. E, HO-1 and GCLM gene expression after 5 h incubation with NATx0 and Tx (5 and 10 μM) was studied by qPCR. One-way ANOVA with Bonferroni's multiple comparison test, HO-1: Control vs Tx 5 and 10 μM ns >0.999; Control vs NATx0 5 μM * = 0.010; Control vs NATx0 10 μM ns = 0.1979; Tx 5 μM vs NATx0 5 μM <0.0001; Tx 10 μM vs NATx0 10 μM <0.0001. F, HO-1 and GCLM protein expression by western blot after 5 h incubation with NATx0 5 and 10 μM.Data are representative of two or three independent experiments. Bar graphs shown are the mean ± S.D. (error bars). . (For interpretation of the references to colour in this figure legend, the reader is referred to the Web version of this article.)
Image
Figure Caption
Acknowledgments
This image is the copyrighted work of the attributed author or publisher, and
ZFIN has permission only to display this image to its users.
Additional permissions should be obtained from the applicable author or publisher of the image.
Full text @ Redox Biol.

