
- Title
-
Toxicogenomic fin(ger)prints for thyroid disruption AOP refinement and biomarker identification in zebrafish embryos
- Authors
- Reinwald, H., König, A., Ayobahan, S.U., Alvincz, J., Sipos, L., Göckener, B., Böhle, G., Shomroni, O., Hollert, H., Salinas, G., Schäfers, C., Eilebrecht, E., Eilebrecht, S.
- Source
- Full text @ Sci. Total Environ.
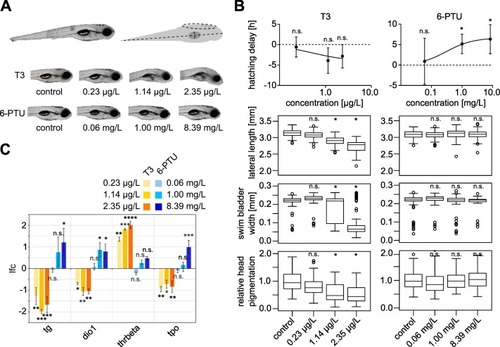
Fig. 1. Thyroid-related effects of T3 and 6-PTU in zebrafish embryos. (A) Physiological endpoints. Top: lateral view of a zebrafish embryo at 120 hpf (left). Lateral length, swim bladder width and head pigmentation measurements are indicated as dotted lines in the schematic view (right). Bottom: representative images of zebrafish embryos exposed to the indicated concentrations of T3 and 6-PTU as compared to non-treated controls. (B) Analysis of physiological endpoints upon exposure to different concentrations of T3 (left) and 6-PTU (right). Top: relative hatching delay compared to the control in hours. Statistical significance was assessed by a one sample t-test. Middle top: lateral length measurements in mm. Middle bottom: swim bladder width measurements in mm. Bottom: relative head pigmentation measurements. Statistical significance was assessed by William's t-test. N.s. not significant, *p ≤ 0.05. (C) RT-qPCR analysis of thyroid-related genes upon exposure to different concentrations of T3 and 6-PTU. The expression of tg, dio1, thrbeta and tpo upon exposure to the indicated concentrations of T3 and 6-PTU was compared to non-treated controls. Log2-fold change (lfc) as compared to the non-treated controls are plotted. Statistical significance was assessed by one-way Anova followed by a Dunnett's multiple comparison test based on three biological replicates. N.s. not significant, *padj ≤ 0.05, **padj ≤ 0.01, ***padj ≤ 0.001, ****padj ≤ 0.0001. |
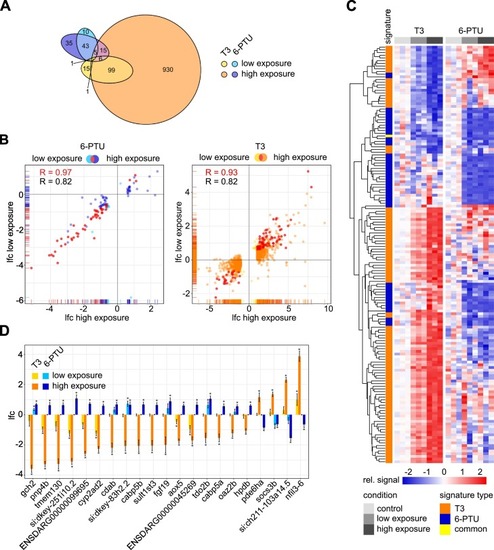
Fig. 2. Transcriptome response of zebrafish embryos to sublethal concentrations of T3 and 6-PTU at 96 hpf. (A) Venn diagram showing differentially expressed genes (DEGs) after exposure to 186.6 μg/L (high exposure, orange) and 1.14 μg/L (low exposure, yellow) T3 and to 108.81 mg/L (high exposure, dark blue) and 1.00 mg/L (low exposure, light blue) 6-PTU as compared to the non-treated controls. Displayed ellipses and intersection sizes correspond to the numbers of DEGs. (B) Scatter plots comparing ll log2-fold change (lfc) values of DEGs observed after low and high exposure to each corresponding substance. The common subset of both exposures is colored in red and considered as a substance-specific signature. (C) Heatmap containing the signature genes, which are indicated in red in the chart (B). The relative signal normalized to the control within each treatment of each gene (rows) is shown for each sample (columns). As compared to the mean of each non-treated control, an enhanced expression is indicated in red and a suppressed expression is indicated in blue. Genes are clustered after maximum distance measure with average linkage. The association with a T3 or a 6-PTU signature is indicated in orange and blue, respectively. Genes associated with both signatures are colored in yellow. (D) Lfc values of potential common marker genes for distinguishing T3 and 6-PTU responses. All genes were observed as DEGs in either low or high exposure condition after exposure to both substances and showed a counter-regulated response for T3 and 6-PTU. * indicates, in which treatment the corresponding gene was observed as a DEG. (For interpretation of the references to colour in this figure legend, the reader is referred to the web version of this article.) |
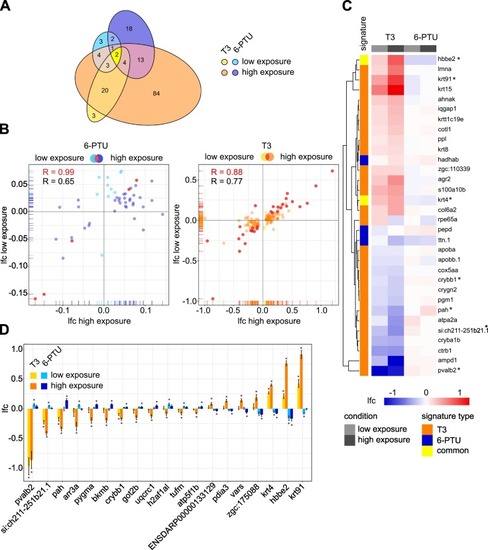
Fig. 3. Proteome response of zebrafish embryos to sublethal concentrations of T3 and 6-PTU at 96 hpf. (A) Venn diagram showing the statistically significantly (padj ≤ 0.05) differentially expressed proteins of the common set of detected proteins after exposure to 186.6 μg/L (high exposure, orange) and 1.14 μg/L (low exposure, yellow) T3 and to 108.81 mg/L (high exposure, dark blue) and 1.00 mg/L (low exposure, light blue) 6-PTU compared to control groups. Displayed ellipses and intersection sizes correspond to the numbers of proteins. (B) Scatter plots comparing the log2-fold change (lfc) values of differentially expressed proteins observed after low and high exposure to each corresponding substance. The common subset is colored in red. (C) Heatmap containing the proteins of the common subsets indicated in red in the chart (B). The lfc of each protein (rows) is shown for each sample (columns). Red heatmap colors represent an enhanced and blue a suppressed expression of the protein. Proteins are clustered after maximum distance measure with average linkage. The association with a T3 or a 6-PTU signature is indicated in orange and blue, respectively. Proteins associated with both signatures are colored in yellow. (D) Lfc values of potential common marker proteins for distinguishing T3 and 6-PTU responses. All proteins were observed as differentially expressed proteins in either low or high exposure condition after exposure to both substances and showed a counter-regulated response for T3 and 6-PTU. * indicates, in which treatment the corresponding protein was observed as differentially expressed. (For interpretation of the references to colour in this figure legend, the reader is referred to the web version of this article.) |
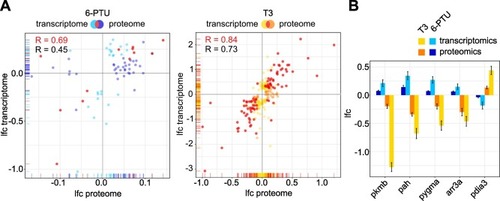
Fig. 4. Comparison of transcriptome and proteome responses to T3 and 6-PTU in zebrafish embryos. (A) Scatter plots comparing the log2-fold change (lfc) values of differentially expressed proteins observed after exposure to each corresponding substance at the levels of transcriptome (y-axis) and proteome (x-axis). The common subset of both methods is colored in red. Pearson correlation coeffcients are given for the common subset (red) and for the remaining proteins (black). (B) Lfc values of potential common marker proteins for distinguishing T3 and 6-PTU responses. All proteins were observed as statistically differentially expressed in transcriptome and proteome analysis after exposure to both substances and showed a counter-regulated response for T3 and 6-PTU. (For interpretation of the references to colour in this figure legend, the reader is referred to the web version of this article.) |
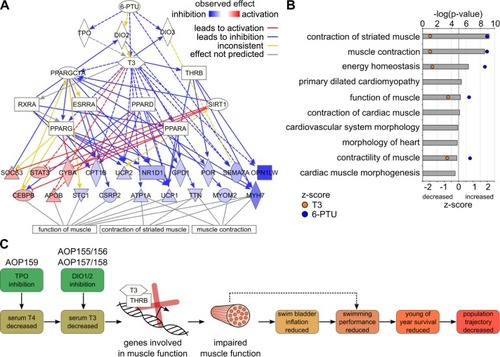
Fig. 5. Upstream regulator and downstream effect analysis of T3/6-PTU target genes. (A) Upstream regulator analysis of the common target gene set of T3 and 6-PTU indicates T3 signaling to be most significantly responsible for the observed gene expression changes. Direct and indirect T3/THRB signaling impacts the expression of different genes involved in muscle contraction and function. The observed up- (red) and down-regulation (blue) of genes is displayed as a colour code after exposure to T3. Functional connections are indicated as colored lines and arrows. For reasons of perceptibility, not all genes are shown. (B) Downstream effect analysis of the common target gene set of T3 and 6-PTU. The top ten statistically significantly enriched physiological functions are displayed ordered by their -log(p-value). The z-score indicates, whether a function is increased (positive) or decreased (negative value) after T3 (orange) and 6-PTU exposure (blue). (C) Proposed refinement of thyroid-related AOPs in fish. Both, induced thyroid signaling by exogenous T3 and reduced thyroid signaling by 6-PTU-mediated inhibition of TPO and DIO, significantly affect the expression of genes involved in muscle function and contraction via direct and indirect pathways shown in (B). The resulting impaired muscle function and contractility may directly affect swim bladder inflation and may indirectly also contribute to a reduced swimming performance. (For interpretation of the references to colour in this figure legend, the reader is referred to the web version of this article.) |