
Fig. 2
- ID
- ZDB-FIG-210303-83
- Publication
- Reinwald et al., 2020 - Toxicogenomic fin(ger)prints for thyroid disruption AOP refinement and biomarker identification in zebrafish embryos
- Other Figures
- All Figure Page
- Back to All Figure Page
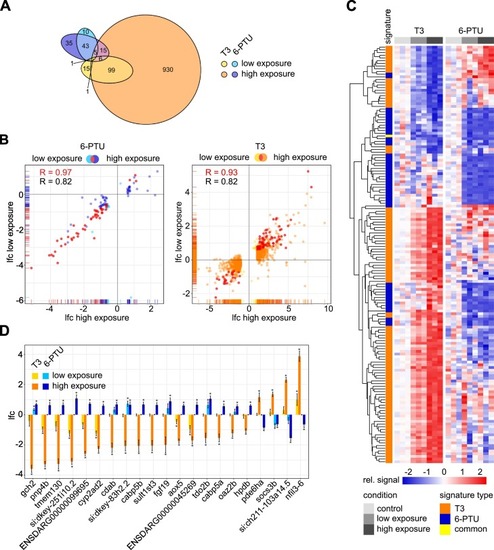
Fig. 2. Transcriptome response of zebrafish embryos to sublethal concentrations of T3 and 6-PTU at 96 hpf. (A) Venn diagram showing differentially expressed genes (DEGs) after exposure to 186.6 μg/L (high exposure, orange) and 1.14 μg/L (low exposure, yellow) T3 and to 108.81 mg/L (high exposure, dark blue) and 1.00 mg/L (low exposure, light blue) 6-PTU as compared to the non-treated controls. Displayed ellipses and intersection sizes correspond to the numbers of DEGs. (B) Scatter plots comparing ll log2-fold change (lfc) values of DEGs observed after low and high exposure to each corresponding substance. The common subset of both exposures is colored in red and considered as a substance-specific signature. (C) Heatmap containing the signature genes, which are indicated in red in the chart (B). The relative signal normalized to the control within each treatment of each gene (rows) is shown for each sample (columns). As compared to the mean of each non-treated control, an enhanced expression is indicated in red and a suppressed expression is indicated in blue. Genes are clustered after maximum distance measure with average linkage. The association with a T3 or a 6-PTU signature is indicated in orange and blue, respectively. Genes associated with both signatures are colored in yellow. (D) Lfc values of potential common marker genes for distinguishing T3 and 6-PTU responses. All genes were observed as DEGs in either low or high exposure condition after exposure to both substances and showed a counter-regulated response for T3 and 6-PTU. * indicates, in which treatment the corresponding gene was observed as a DEG. (For interpretation of the references to colour in this figure legend, the reader is referred to the web version of this article.) |