
Fig. 4
- ID
- ZDB-FIG-210303-85
- Publication
- Reinwald et al., 2020 - Toxicogenomic fin(ger)prints for thyroid disruption AOP refinement and biomarker identification in zebrafish embryos
- Other Figures
- All Figure Page
- Back to All Figure Page
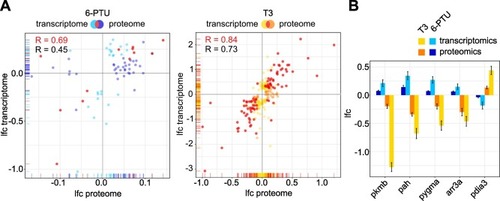
Fig. 4. Comparison of transcriptome and proteome responses to T3 and 6-PTU in zebrafish embryos. (A) Scatter plots comparing the log2-fold change (lfc) values of differentially expressed proteins observed after exposure to each corresponding substance at the levels of transcriptome (y-axis) and proteome (x-axis). The common subset of both methods is colored in red. Pearson correlation coeffcients are given for the common subset (red) and for the remaining proteins (black). (B) Lfc values of potential common marker proteins for distinguishing T3 and 6-PTU responses. All proteins were observed as statistically differentially expressed in transcriptome and proteome analysis after exposure to both substances and showed a counter-regulated response for T3 and 6-PTU. (For interpretation of the references to colour in this figure legend, the reader is referred to the web version of this article.) |